Chapter 17: Appendicitis
James E. Everhart, M.D., M.P.H.
Being an acute surgical condition, appendicitis was not especially common at ambulatory care visits, but did account for an estimated 600,000 first-listed ambulatory care visits (Table 1), which was as frequent as those for ulcerative colitis or pancreatitis. Visit rates were nearly equal across age groups up to age 65. Rates were higher among blacks and males. Hospital discharges more accurately reflected disease occurrence. In 2004, there were an estimated 325,000 hospitalizations with a diagnosis of appendicitis, of which 91.7 percent were first-listed diagnosis. This proportion of first-listed diagnoses was higher than that of any other digestive disease and changed little over 20 years.12 Discharge rates did not differ markedly by age. The rate among whites was twice that of blacks, while the rate for males was 20 percent greater than that for females.
Rates of ambulatory care visits increased from 1992–1993 to 2003–2005, but the more significant trends were for hospital discharges (Figure 1). Hospitalizations with a diagnosis of appendicitis declined from 1979 through 1995, continuing a decline that began at least in 1965, if not earlier.13 Between 1995 and 2004, the trend reversed, such that there was a 34 percent increase in the rate of hospital discharges with a diagnosis of appendicitis.
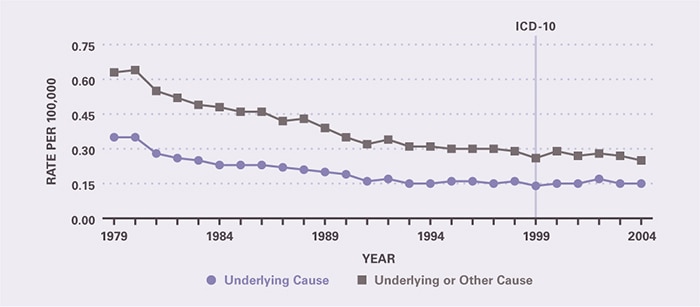
Deaths from appendicitis were uncommon in 2004, with the large majority occurring at age 65 years and older, indicating a high case-fatality rate among older persons (Table 2). Mortality rates from appendicitis continued a many-year decline until 1991 (Figure 2). From 1991 onward, rates remained stable.
Because appendicitis is a surgical condition requiring hospitalization, prescriptions filled at retail pharmacies captured through the Verispan database (Appendix 2) were not frequent nor necessarily representative of the medications used in this condition. In 2004, there were an estimated 315,000 such medications prescribed, at a retail cost of $5.6 million. More than 98 percent of these medications were for pain relievers, with the rest for antimicrobial agents.
References
Table 1. Appendicitis: Number and Age-Adjusted Rates of Ambulatory Care Visits and Hospital Discharges With First-Listed and All-Listed Diagnoses by Age, Race, and Sex in the United States, 2004
| Demographic Characteristics | Ambulatory Care Visits First-Listed Diagnosis Number in Thousands | Ambulatory Care Visits First-Listed Diagnosis Rate per 100,000 | Ambulatory Care Visits All-Listed Diagnosis Number in Thousands | Ambulatory Care Visits All-Listed Diagnosis Rate per 100,000 | Hospital Discharges First-Listed Diagnosis Number in Thousands | Hospital Discharges First-Listed Diagnosis Rate per 100,000 | Hospital Discharges All-Listed Diagnosis Number in Thousands | Hospital Discharges All-Listed Diagnosis Rate per 100,000 |
|---|---|---|---|---|---|---|---|---|
| AGE (Years) Under 15 |
106 | 174 | 163 | 267 | 61 | 101 | 63 | 103 |
| AGE (Years) 15–44 |
358 | 284 | 458 | 364 | 156 | 124 | 169 | 134 |
| AGE (Years) 45–64 |
133 | 188 | 150 | 212 | 58 | 83 | 65 | 93 |
| AGE (Years) 65+ |
— | — | — | — | 21 | 59 | 26 | 72 |
| Race White |
469 | 200 | 607 | 260 | 232 | 99 | 253 | 107 |
| Race Black |
— | — | 139 | 355 | 18 | 45 | 21 | 53 |
| Sex Female |
260 | 179 | 372 | 258 | 126 | 86 | 144 | 98 |
| Sex Male |
341 | 232 | 410 | 279 | 164 | 112 | 172 | 118 |
| Total | 601 | 205 | 782 | 266 | 298 | 101 | 325 | 111 |
Figure 1. Appendicitis: Age-Adjusted Rates of Ambulatory Care Visits and Hospital Discharges With All–Listed Diagnoses in the United States, 1979–2004
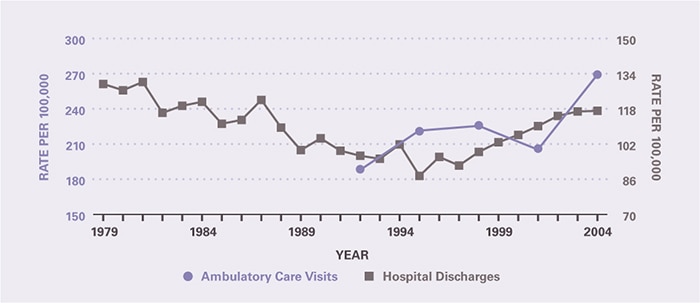
Table 2. Appendicitis: Number and Age-Adjusted Rates of Deaths and Years of Potential Life Lost (to Age 75) by Age, Race, and Sex in the United States, 2004
| Demographic Characteristics | Underlying Cause Number of Deaths | Underlying Cause Rate per 100,000 | Underlying Cause Years of Potential Life Lost in Thousands | Underlying or Other Cause Number of Deaths | Underlying or Other Cause Rate per 100,000 |
|---|---|---|---|---|---|
| AGE (Years) Under 15 |
21 | 0.0 | 1.4 | 33 | 0.1 |
| AGE (Years) 15–44 |
31 | 0.0 | 1.4 | 45 | 0.0 |
| AGE (Years) 45–64 |
97 | 0.1 | 1.9 | 168 | 0.2 |
| AGE (Years) 65+ |
304 | 0.8 | 0.3 | 516 | 1.4 |
| Race White |
378 | 0.1 | 3.7 | 646 | 0.2 |
| Race Black |
59 | 0.2 | 1.0 | 90 | 0.3 |
| Sex Female |
200 | 0.1 | 1.4 | 341 | 0.2 |
| Sex Male |
253 | 0.2 | 3.6 | 421 | 0.3 |
| Total | 453 | 0.2 | 5.0 | 762 | 0.3 |
Figure 2. Appendicitis: Age-Adjusted Rates of Death in the United States, 1979–2004