
Chapter 24: Indications & Outcomes of Gastrointestinal Endoscopy
Constance E. Ruhl, M.D., Ph.D.; and James E. Everhart, M.D., M.P.H.
Through diagnosis and management, endoscopy plays a role in nearly all GI diseases as well as a crucial role in clinical research. It is estimated that more than 20 million GI endoscopies are performed yearly in the United States.26 There is no single national endoscopic database that can provide accurate population-based information on the absolute number of GI endoscopies and their indications and diagnostic outcomes. To remedy this important gap in knowledge on the burden of GI disease, data were obtained from the Clinical Outcomes Research Initiative’s (CORI) National Endoscopic Database (NED). For more than 10 years, this project has collected and analyzed computerized endoscopic records gathered from diverse endoscopic practices throughout the United States. Pediatric procedures are not represented, and the participating sites are overrepresented by veteran and military facilities. Nevertheless, the patterns of endoscopy in NED have been shown to be quite similar to that of a national sample of the Medicare population and may well be applicable to the United States as a whole.27 There is no independent confirmation of the indications and diagnoses reported by the endoscopist on the endoscopy record, although the report is frequently included in the medical record and used for billing.
For this report, endoscopic data were obtained for the period 2001–2005. The number of patients receiving the various endoscopic procedures, along with the practices and practice sites where the procedures were conducted, is shown in Table 1. Of the 885,593 procedures performed during this period, 61.2 percent were colonoscopies, 30.6 percent were esophagogastroduodenoscopies (EGD), 6.3 percent were flexible sigmoidoscopies, 1.0 percent were endoscopic retrograde cholangiopancreatography (ERCP), and 0.8 percent were endoscopic ultrasonographies (EUS). Colonoscopy, flexible sigmoidoscopy, and EGD were primarily performed within community or health maintenance organization (HMO) practices in hospital or ambulatory surgery centers. The more specialized procedures of ERCP and EUS were more likely to have been performed in academic centers and almost exclusively in the hospital. Age 50–59 years was the peak age group for all the procedures. There was some ethnic variation in likelihood of receiving a particular procedure, relative to all procedures. Non-Hispanic whites were more likely to have undergone colonoscopy (85.9 percent) and EUS (86.9 percent), non-Hispanic blacks (13.3 percent) and Asian-Pacific Islanders (2.2 percent) flexible sigmoidoscopy, and Native Americans (6.0 percent) and Hispanics (12.4 percent) ERCP. Excluding Veterans Affairs (VA) facilities, the majority of procedures were performed on women.
Of the 101 sites providing data to NED during 2001–2005, 36 did so throughout the 5-year period. At these “stable” sites, the total number of procedures increased by 34.1 percent from 2001 to 2005, but trends differed by procedure (Figure 1). Colonoscopy increased 63.4 percent, partly at the expense of flexible sigmoidoscopy, which decreased by 60.0 percent. EGD increased by 20.3 percent. The frequency of each of these procedures peaked at age 50–59 years, but more so for colonoscopy (Figure 2). At the stable sites, the growth in colonoscopy from 2001 to 2005 was concentrated among this age group and to a lesser extent among persons ages 60–69 years (Figure 3). The number of colonoscopies among other age groups changed little. In contrast, the number of sigmoidoscopies at stable sites declined appreciably among persons ages 40–79 years, but most among those ages 50–79 (Figure 4).
The distribution of indications for all colonoscopies and sigmoidoscopies is shown in Table 2. Because there could be more than one indication for a procedure, the totals of the percentages exceeded 100 percent. Broadly speaking, surveillance and symptoms were more often listed as indications for colonoscopy than for sigmoidoscopy, while screening was a more frequent indication for sigmoidoscopy than for colonoscopy. Suspected bleeding was the most common indication for colonoscopy (29.7 percent), followed by screening of persons at routine risk of colorectal cancer (21.6 percent), surveillance of adenomatous polyps (13.5 percent), and screening for persons with a family history of colorectal cancer (12.1 percent). These most common indications for colonoscopy indicate that concern over possible colorectal cancer was the predominant reason for colonoscopy. The same statement can be made for sigmoidoscopy, except that a high percentage (47.4 percent) were performed for persons at routine risk of colorectal cancer.
The findings among persons who had colonoscopies or sigmoidoscopies are shown in Table 3. The most interesting group is the column of colonoscopic findings among persons at routine risk only, among whom findings should not have been influenced by symptoms or other indications for the procedure. As long as all abnormalities were recorded, these may be considered the prevalence of such findings in the general population. Common but benign conditions such as diverticulosis and hemorrhoids may not have been recorded if a more serious problem was diagnosed. Notably, 21.0 percent of examinations were normal and 6.4 percent found a polyp of at least 1 centimeter or a suspected malignancy. Figure 5 demonstrates colonoscopic findings among persons at routine risk according to age group. Diverticulosis, the most common finding, steadily increased in prevalence from age 50–59 years to age 80 years and older, at which point it was found on 71.4 percent of examinations. Increasing in prevalence with age, but not as quickly as diverticulosis, were polyps of all sizes and number, and hemorrhoids. The prevalence of normal examinations fell from 36.2 percent at age 20–39 years to 10.2 percent at 80 years and above. There was a higher prevalence of polyps among men than women at routine risk (Figure 6), but no other particular differences by sex. Hemorrhoids were more common among Hispanics, but no other racial or ethnic differences were evident (Figure 7).
In contrast to the uneven increase in utilization of colonoscopy across age groups, EGD use increased modestly across all age groups at stable sites (Figure 8). The indications for EGD at all NED sites are shown in Table 4. These indications were not mutually exclusive and included groupings of symptoms, notably alarm symptoms (weight loss, vomiting, or bleeding) and bleeding (anemia, iron deficiency, melena, hematemesis, hematochezia, positive fecal occult blood test, or suspected upper GI bleed). The most common indications for EGD were reflux symptoms (28.3 percent), alarm symptoms (27.7 percent), dysphagia (20.5 percent), signs of bleeding (20.4 percent), and abdominal pain or bloating (20.1 percent). More than 40 percent of examinations had normal findings (Table 5). The most common diagnostic abnormalities were mucosal abnormality, hiatal hernia, and esophageal inflammation, each of which is characteristic of GERD. The next three most common diagnoses, stricture/stenosis, Barrett’s esophagus, and ulcer, can be consequences of GERD. Combining these diagnoses, it can be inferred that the large majority of abnormal findings on EGD are associated with GERD.
ERCP findings from 2001–2005 are shown in Table 6. Because there were fewer than 10,000 ERCP reports from relatively few centers, the generalizability of the results is questionable. Also, some important information appeared in free text fields in the report, making interpretation more difficult. Nevertheless, it appeared that ductal abnormalities and obstruction to flow were the most common findings on ERCP, and that one-third of examinations were normal. EUS was performed too infrequently and at too few sites to present information on either indication or results.
References
Table 1. Characteristics of Endoscopy Sites and Persons Undergoing Endoscopic Procedures, 2001–2005
| Colonoscopy | EGD | Flexible Sigmoidoscopy | ERCP | EUS | |
|---|---|---|---|---|---|
| Number of Patients | 542,650 | 270,957 | 55,708 | 9,333 | 6,945 |
| Number of Practices | 76 | 77 | 72 | 40 | 23 |
| Number of Sites | 101 | 101 | 96 | 44 | 25 |
| Site CHARACTERISTICS (Percentage) | |||||
| TYPE OF ENDOSCOPY SITE Community/HMO | 78.1 | 72.8 | 58.5 | 40.1 | 2.9 |
| TYPE OF ENDOSCOPY SITE Academic | 11.3 | 14.6 | 16.6 | 41.1 | 66.5 |
| TYPE OF ENDOSCOPY SITE VA/Military | 10.6 | 12.6 | 24.9 | 18.8 | 30.6 |
| TYPE OF FACILITY Office | 1.7 | 2.7 | 1.1 | < 0.1 | 0 |
| TYPE OF FACILITY Hospital | 40.9 | 49.7 | 51.3 | 96.7 | 100 |
| TYPE OF FACILITY Ambulatory Surgery Center | 57.4 | 47.6 | 47.7 | 3.3 | < 0.1 |
| PATIENT CHARACTERISTICS (Percentage) | |||||
| AGE (Years) 20–29 | 1.7 | 4.6 | 5.6 | 9.2 | 2.3 |
| AGE (Years) 30–39 | 4.0 | 9.4 | 8.6 | 10.3 | 5.3 |
| AGE (Years) 40–49 | 11.7 | 17.4 | 12.2 | 14.1 | 13.1 |
| AGE (Years) 50–59 | 32.9 | 23.1 | 34.6 | 19.3 | 24.3 |
| AGE (Years) 60–69 | 25.6 | 19.5 | 19.8 | 16.5 | 24.1 |
| AGE (Years) 70–79 | 18.4 | 17.5 | 13.6 | 18.3 | 22.8 |
| AGE (Years) 80+ | 5.9 | 8.6 | 5.6 | 12.4 | 8.1 |
| Race/Ethnicity Non-Hispanic White | 85.9 | 81.3 | 78.2 | 72.0 | 86.9 |
| Race/Ethnicity Non-Hispanic Black | 6.4 | 7.3 | 13.3 | 7.5 | 5.0 |
| Race/Ethnicity Asian/Pacific Islander | 1.5 | 2.0 | 2.2 | 1.8 | 1.8 |
| Race/Ethnicity American Indian/ Alaska Native | 0.8 | 1.2 | 0.9 | 6.0 | 0.4 |
| Race/Ethnicity Multiracial Non-Hispanic | 0.2 | 0.2 | 0.6 | 0.3 | 0.3 |
| Race/Ethnicity Hispanic | 5.3 | 8.0 | 4.8 | 12.4 | 5.6 |
| Sex Female | 49.6 | 51.4 | 41.0 | 52.0 | 40.7 |
| Sex Male | 50.4 | 48.6 | 59.0 | 48.0 | 59.3 |
| Sex (Excluding VA/Military) Number of Patients | 485, 085 | 236, 848 | 41,839 | 7,577 | 4,819 |
| Sex (Excluding VA/Military) Female | 54.3 | 57.2 | 52.7 | 61.1 | 51.6 |
| Sex (Excluding VA/Military) Male | 45.8 | 42.8 | 47.3 | 38.9 | 48.4 |
Figure 1. Number of Endoscopic Procedures at Stable Sites (N=36) by Year, 2001–2005
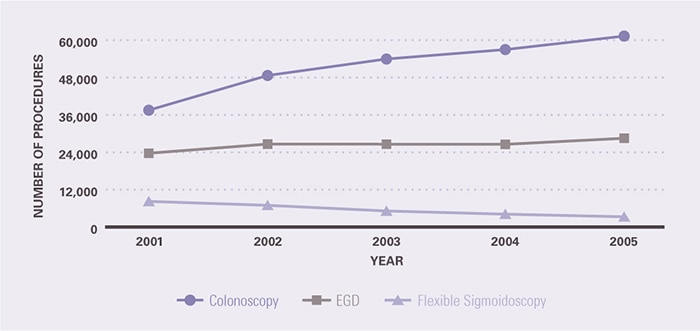
Figure 2. Number of Endoscopic Procedures by Age, 2001–2005
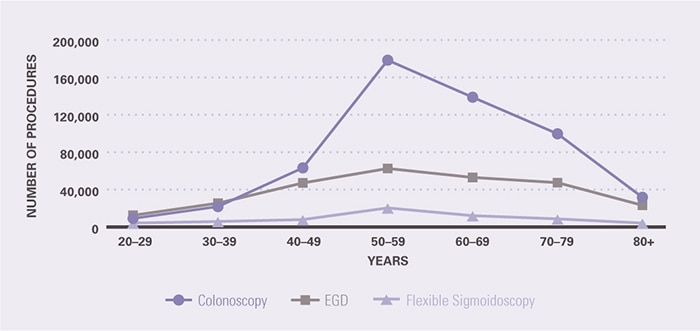
Figure 3. Number of Colonoscopies at Stable Sites (N=36) by Age and Year, 2001–2005
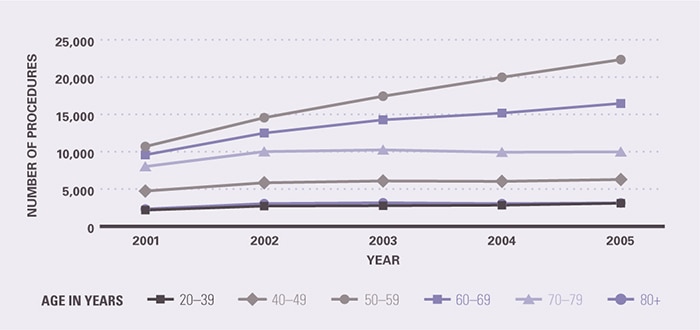
Figure 4. Number of Flexible Sigmoidoscopies at Stable Sites (N=36) by Age and Year, 2001–2005
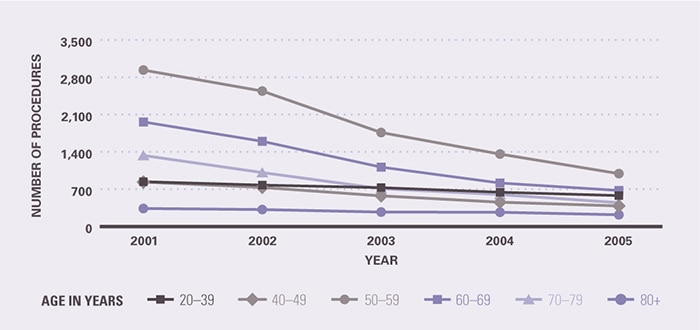
Table 2. Indications for Colonoscopy and Flexible Sigmoidoscopy, 2001–2005
| PERCENTAGE1 | ||
|---|---|---|
| INDICATION | Colonoscopy (N=542,650) | Flexible Sigmoidoscopy (N=55,708) |
| SURVEILLANCE Surveillance of Adenomatous Polyps |
13.5 | 2.4 |
| SURVEILLANCE Surveillance of Colorectal Cancer |
2.0 | 1.0 |
| SURVEILLANCE Surveillance of Ulcerative Colitis |
0.9 | 1.0 |
| SURVEILLANCE Surveillance of Crohn’s Disease |
0.6 | 0.4 |
| SURVEILLANCE Established Crohn’s Disease |
0.2 | 0.2 |
| SURVEILLANCE Established Ulcerative Colitis |
0.2 | 0.6 |
| SCREENING Routine Risk Only |
21.6 | 47.4 |
| SCREENING Family History of Colorectal Cancer |
12.1 | 1.0 |
| SCREENING Family History of Polyps |
2.8 | 0.3 |
| SYMPTOMS Bleeding Group2 |
29.7 | 21.7 |
| SYMPTOMS Irritable Bowel Syndrome Cluster3 |
18.2 | 15.0 |
| SYMPTOMS Hematochezia |
17.9 | 20.4 |
| SYMPTOMS Abdominal Pain/Bloating |
9.1 | 5.4 |
| SYMPTOMS Diarrhea |
7.6 | 9.9 |
| SYMPTOMS Positive Fecal Occult Blood Test |
7.2 | 0.7 |
| SYMPTOMS Change in Bowel Habits |
7.1 | 1.6 |
| SYMPTOMS Anemia |
5.7 | 0.9 |
| SYMPTOMS Constipation |
5.4 | 4.5 |
| SYMPTOMS Weight Loss |
1.6 | 0.5 |
| SYMPTOMS Melena |
0.7 | 0.2 |
| SYMPTOMS Iron Deficiency Without Anemia |
0.3 | < 0.1 |
| FOLLOWUP OF DIAGNOSIS Polyp Found on Flexible Sigmoidoscopy |
1.5 | 0.2 |
| FOLLOWUP OF DIAGNOSIS Abnormal Study |
1.0 | 1.2 |
| FOLLOWUP OF DIAGNOSIS History of Non-Gastrointestinal Cancer |
0.8 | 0.3 |
| FOLLOWUP OF DIAGNOSIS Suspected Inflammatory Bowel Disease |
0.5 | 0.6 |
| FOLLOWUP OF DIAGNOSIS Polyp Found on Barium Enema |
0.2 | 0.1 |
| FOLLOWUP OF DIAGNOSIS Polyp Found on Previous Colonoscopy |
0.2 | 0.4 |
| OTHER | 6.5 | 11.5 |
Table 3. Colonoscopy Findings in the Total Population and Persons at Routine Risk Only, and Flexible Sigmoidoscopy Findings, 2001–2005
| FINDING | Percentage1 Colonoscopy Total Population (N=542,650) | Percentage1 Colonoscopy Routine Risk Only (N=117,422) | Percentage1 Flexible Sigmoidoscopy (N=55,708) |
|---|---|---|---|
| Diverticulosis | 42.8 | 45.0 | 22.3 |
| Hemorrhoids | 39.6 | 34.2 | 31.7 |
| Polyp | 35.9 | 37.4 | 16.2 |
| Normal Exam/No Findings | 17.6 | 21.0 | 30.5 |
| Polyp > 9mm/Suspected Malignant Tumor | 7.6 | 6.4 | 3.4 |
| Multiple Polyps | 7.2 | 7.2 | 2.8 |
| Mucosal Abnormality-Colitis | 5.2 | 1.4 | 7.8 |
| Tumor | 1.2 | 0.4 | 0.9 |
| Angiodysplasia (AVM) | 1.1 | 0.7 | 0.3 |
| Other Finding | 9.8 | 6.6 | 12.1 |
Figure 5. Colonoscopy Findings in Persons at Routine Risk by Age, 2001–2005
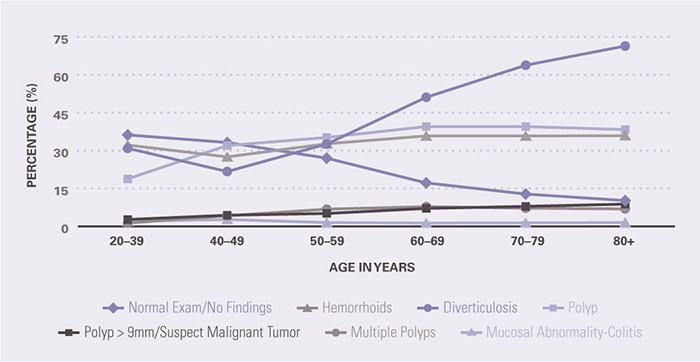
Figure 6. Colonoscopy Findings in Persons at Routine Risk by Sex, 2001–2005
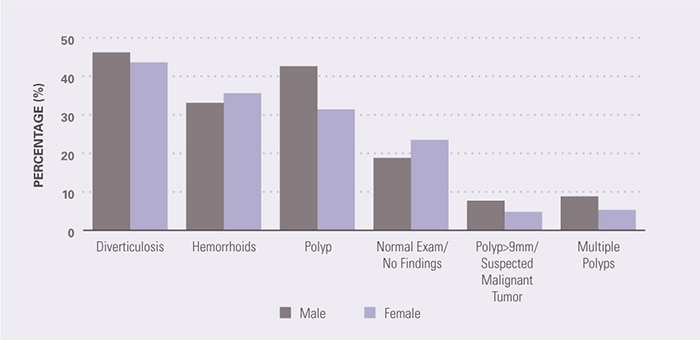
Figure 7. Colonoscopy Findings in Persons at Routine Risk by Race/Ethnicity, 2001–2005
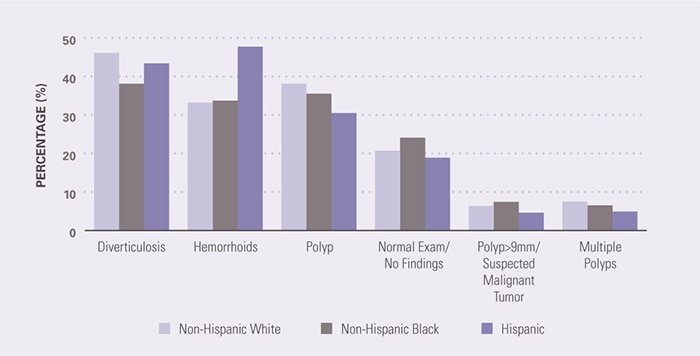
Figure 8. Number of Esophagogastroduodenoscopy (EGD) Procedures at Stable Sites (N=36) by Age and Year, 2001–2005
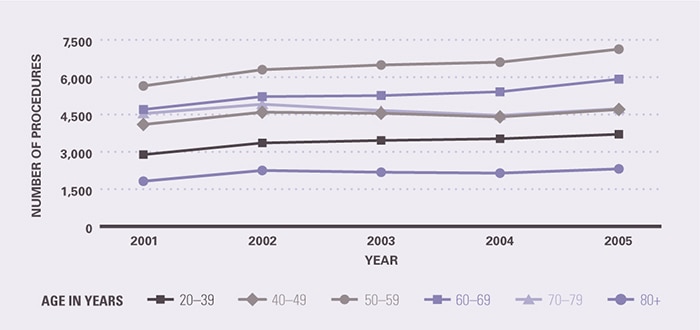
Table 4. Indications for Esophagogastroduodenoscopy (EGD) (N=270,957), 2001–2005
| INDICATION | PERCENTAGE1 |
|---|---|
| SURVEILLANCE Surveillance of Barrett’s Esophagus |
3.1 |
| SURVEILLANCE Surveillance of Gastric Ulcer |
1.0 |
| SURVEILLANCE Surveillance of Varices |
0.9 |
| SURVEILLANCE Surveillance of Helicobacter Pylori |
0.3 |
| SURVEILLANCE Surveillance of Duodenal Ulcer |
0.2 |
| SURVEILLANCE Surveillance of Gastric Polyps |
0.2 |
| SCREENING Screening for Barrett’s Esophagus |
1.5 |
| SCREENING Screening for Varices |
0.9 |
| SYMPTOMS Reflux Symptoms/Heartburn |
28.3 |
| SYMPTOMS Alarm Symptoms2 |
27.7 |
| SYMPTOMS GERD3 |
22.3 |
| SYMPTOMS Dyspepsia/Abdominal Pain4 |
21.6 |
| SYMPTOMS Dysphagia |
20.5 |
| SYMPTOMS Bleeding Cluster5 |
20.4 |
| SYMPTOMS Abdominal Pain/Bloating |
20.1 |
| 10.5 | |
| SYMPTOMS Dyspepsia |
9.7 |
| SYMPTOMS Nausea |
6.7 |
| 4.9 | |
| SYMPTOMS Melena |
4.6 |
| SYMPTOMS Weight Loss |
4.0 |
| SYMPTOMS Chest Pain |
3.9 |
| SYMPTOMS Hematemesis |
2.8 |
| SYMPTOMS Diarrhea |
2.4 |
| SYMPTOMS Early Satiety |
1.3 |
| SYMPTOMS Hematochezia |
0.9 |
| SYMPTOMS Anorexia |
0.8 |
| SYMPTOMS Odynophagia |
0.7 |
| SYMPTOMS Pulmonary Symptoms |
0.7 |
| SYMPTOMS Iron Deficiency Without Anemia |
0.5 |
| SYMPTOMS Malabsorption |
0.2 |
| SYMPTOMS Feeding Refusal |
0.1 |
| FOLLOWUP OF DIAGNOSIS Positive Fecal Occult Blood Test |
2.7 |
| FOLLOWUP OF DIAGNOSIS Suspected Upper Gastrointestinal Bleed |
2.5 |
| FOLLOWUP OF DIAGNOSIS Abnormal Study/Exam/Results |
2.1 |
| FOLLOWUP OF DIAGNOSIS Therapeutic Intervention |
1.2 |
| FOLLOWUP OF DIAGNOSIS Evaluation of Suspected Varices |
0.8 |
| FOLLOWUP OF DIAGNOSIS Suspected Barrett’s Esophagus |
0.4 |
| FOLLOWUP OF DIAGNOSIS Family History of Cancer |
0.3 |
| FOLLOWUP OF DIAGNOSIS Prior Upper Gastrointestinal Cancer |
0.2 |
| FOLLOWUP OF DIAGNOSIS Gastrointestinal Symptoms in Immunocompromised Host |
0.1 |
| FOLLOWUP OF DIAGNOSIS Personal History of Other Upper Gastrointestinal Condition |
0.1 |
| FOLLOWUP OF DIAGNOSIS Evaluation of Crohn’s Disease |
< 0.1 |
| Other | 8.4 |
Table 5. Esophagogastroduodenoscopy (EGD) Findings (N=270,957), 2001–2005
| FINDING | PERCENTAGE1 |
|---|---|
| Normal Exam | 41.5 |
| Mucosal Abnormality | 38.8 |
| Hiatal Hernia | 33.4 |
| Esophageal Inflammation | 17.8 |
| Stricture/Stenosis | 9.9 |
| Barrett’s Esophagus | 6.7 |
| Ulcer | 6.3 |
| Polyp | 4.5 |
| Varices | 2.8 |
| Prior Surgery | 2.6 |
| Foreign Body/Retained Food | 2.1 |
| Nodule | 2.0 |
| Anatomical Deformity | 1.0 |
| Tumor | 0.9 |
| Arteriovenous Malformation | 0.9 |
| Healed Ulcer | 0.5 |
| Other Finding | 18.0 |
Table 6. Endoscopic Retrograde Cholangiopancreatography (ERCP) Findings (N=9,333), 2001–2005
| FINDING | PERCENTAGE1 |
|---|---|
| Ductal Dilation | 37.2 |
| Normal Exam | 34.6 |
| Stones | 25.9 |
| Stricture/Stenosis | 18.1 |
| Filling Defect | 8.5 |
| Duodenal Diverticulum | 5.7 |
| Stent | 4.6 |
| Leak/Extravasation | 3.1 |
| Irregularity | 2.3 |
| Tumor | 1.5 |
| Pancreas Divisum | 1.0 |
| Pancreatitis | 0.7 |
| Extrinsic Compression | 0.5 |
| Pancreatic Pseudocyst | 0.4 |
| Cholangitis | 0.3 |
| Other Finding | 28.2 |