
Chapter 3: Viral Hepatitis
James E. Everhart, M.D., M.P.H.
The primary forms of viral hepatitis in the United States are hepatitis A, B, and C (see ICD codes in Appendix 1). Hepatitis A is common and can be serious or even lethal. It does not have a chronic form. Hepatitis B can cause both acute and chronic disease, whereas acute hepatitis C is often asymptomatic, and its burden is predominantly due to chronic disease.
HEPATITIS A
Although the infection is common, hepatitis A is infrequently recognized in the ambulatory care or hospital setting. It was too infrequent to appear in the office-based sample of the National Ambulatory Medical Care Survey (Table 1). Hospitalization rates declined by about 75 percent between 1979 and 1993, and remained relatively stable through 2004. An effective vaccine to prevent infection was introduced in the 1990s, but it has not had a noticeable effect on reducing hospitalizations (Figure 1). Mortality from hepatitis A was rare, with fewer than 100 deaths per year (Table 2). Unlike recently stable rates of hospitalizations, the death rate from viral hepatitis A was halved between 1999 and 2004 (Figure 2).
HEPATITIS B
Viral hepatitis B is a more significant disease than hepatitis A. In the United States, infections were most commonly recognized between ages 15 and 44 years, and hospitalizations with the diagnosis occurred across the age range of adults (Table 3). Rates of both ambulatory care visits and hospitalizations with hepatitis B were higher among blacks than whites and among males than females. Hepatitis B was rarely the first-listed hospital diagnosis. There has been a vaccine available for hepatitis B since the 1980s, but the rates of both ambulatory care and hospitalizations have increased markedly since 1999 (Figure 3). This increase has been attributed to increased rates of immigration of chronic carriers of hepatitis B virus. Although not a common cause of death, viral hepatitis B resulted in about 10 times as many deaths as hepatitis A (Table 4). The majority of deaths with hepatitis B as either underlying or contributing cause occurred in middle age, between age 45 and 64 years. As with other forms of infections, hepatitis B was more often listed as a contributing than as an underlying cause. Deaths from hepatitis B increased between 1979 and 1994, but mortality steadily declined thereafter, in spite of (or perhaps related to) the increased rates of medical care (Figure 4). As an underlying cause, rates in 2004 were similar to those in 1979, but as a contributing cause, rates were considerably higher in 2004 than they had been 25 years earlier. Age-adjusted mortality was higher among blacks than whites.
HEPATITIS C
The hepatitis C virus was discovered in 1989, and tests for it soon followed. Most prior cases of non-A, non-B hepatitis are believed to have been viral hepatitis C. In both the outpatient and inpatient setting, more than half the cases were in persons ages 45–64 years (Table 5). Rates were at least twice as high among blacks as whites and among males as females. Viral hepatitis C was rarely the first-listed diagnosis at hospital discharge, but was frequently listed as a secondary diagnosis. As a result, only 2.6 percent of hospital discharge diagnoses for hepatitis C listed it as the first-listed diagnosis. Where hepatitis C was not the first-listed diagnosis, the most common underlying (first-listed) causes were chronic liver disease and its sequelae (10.4 percent), mood disorders (4.5 percent), cellulitis (3.8 percent), complications of procedures (2.6 percent), pneumonia (2.5 percent), and HIV (2.4 percent). The majority of hospitalizations, however, appeared to be unrelated to hepatitis C, suggesting that the diagnoses may appear as a result of testing for hepatitis C, rather than as consequences of hepatitis C. Blacks and men had the highest age-adjusted rates.
Both outpatient and inpatient diagnoses have greatly increased since hepatitis C received its own ICD code in the early 1990s (Figure 5). The number of hospitalizations prior to 1992 was too small to provide estimates. Much of the increase can be attributed to increasing recognition of the disease. There was also the introduction of antiviral therapy that required frequent patient monitoring. It is not clear how much of the increase can be attributed to the consequences of disease burden due to longstanding infection.
In 2004, 85 percent of hepatitis-related deaths were from viral hepatitis C. Hepatitis C was listed as a contributing cause of death more often than as the underlying cause (Table 6). About two-thirds of deaths occurred between the ages of 45 and 64 years. Age-adjusted death rates among blacks were nearly twice those of whites, and males had more than double the death rate of females. Hepatitis C contributed a high number of YPLL before the age of 75 years (87,500), because of the large number of deaths and because few deaths are attributed to the disease after age 75. This number placed hepatitis C as the fifth leading digestive disease cause of YPLL, behind esophageal cancer and ahead of gastric cancer. In keeping with the growing identification and long-term consequences of the disease, mortality rates increased rapidly from 1990 to 2004 (Figure 6). (The few deaths recorded prior to 1990 were for non-A, non-B viral hepatitis.) Of note, the mortality rate for hepatitis C as underlying cause leveled off beginning in 2001 and as underlying or contributing cause in 2002.
ALL VIRAL HEPATITIS
The burden of all viral hepatitis primarily reflected that of hepatitis B in past years and, more recently, hepatitis C (Tables 7 and 8, Figures 7 and 8). For example, 97.5 percent of the YPLL prior to age 75 years due to viral hepatitis was a result of hepatitis B (11.6 percent) or hepatitis C (85.9 percent).
MEDICATIONS
The costliest prescriptions filled at retail pharmacies for viral hepatitis in 2004, according to the Verispan database (Appendix 2), are shown in Table 9. An estimated 637,000 outpatient prescriptions were filled, but these were represented by few drugs, which were prescribed exclusively for hepatitis B (adefovir and lamivudine) or hepatitis C (ribavirin and peginterferon). When used to treat hepatitis C, ribavirin was nearly always used with interferon. For a full course of therapy, each of the medications in Table 9 would have required multiple prescriptions.
Table 1. Hepatitis A: Number and Age-Adjusted Rates of Ambulatory Care Visits and Hospital Discharges With First-Listed and All-Listed Diagnoses by Age, Race, and Sex in the United States, 2004
| Demographic Characteristics | Ambulatory Care Visits First-Listed Diagnosis Number in Thousands | Ambulatory Care Visits First-Listed Diagnosis Rate per 100,000 | Ambulatory Care Visits All-Listed Diagnosis Number in Thousands | Ambulatory Care Visits All-Listed Diagnosis Rate per 100,000 | Hospital Discharges First-Listed Diagnosis Number in Thousands | Hospital Discharges First-Listed Diagnosis Rate per 100,000 | Hospital Discharges All-Listed Diagnosis Number in Thousands | Hospital Discharges All-Listed Diagnosis Rate per 100,000 |
|---|---|---|---|---|---|---|---|---|
| AGE (Years) Under 15 |
— | — | — | — | 0 | 1 | 0 | 1 |
| AGE (Years) 15–44 |
— | — | — | — | 1 | 1 | 3 | 3 |
| AGE (Years) 45–64 |
— | — | — | — | 0 | 1 | 4 | 5 |
| AGE (Years) 65+ |
— | — | — | — | 0 | 1 | 2 | 6 |
| Race White |
— | — | — | — | 2 | 1 | 7 | 3 |
| Race Black |
— | — | — | — | 0 | 0 | 2 | 4 |
| Sex Female |
— | — | — | — | 1 | 1 | 5 | 3 |
| Sex Male |
— | — | — | — | 1 | 1 | 5 | 3 |
| Total | — | — | — | — | 2 | 1 | 10 | 3 |
Figure 1. Hepatitis A: Age-Adjusted Rates of Ambulatory Care Visits and Hospital Discharges With All–Listed Diagnoses in the United States, 1979–2004 (Ambulatory Care Visit Data Unavailable)
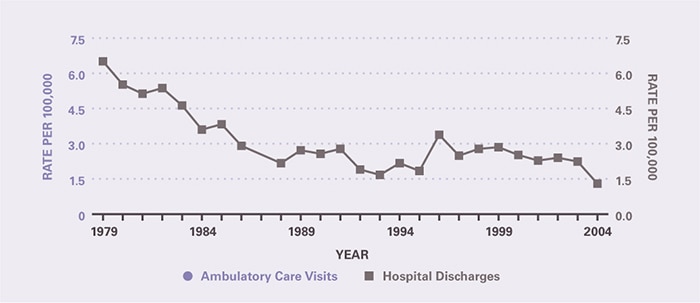
Table 2. Hepatitis A: Number and Age-Adjusted Rates of Deaths and Years of Potential Life Lost (to Age 75) by Age, Race, and Sex in the United States, 2004
| Demographic Characteristics | Underlying Cause Number of Deaths | Underlying Cause Rate per 100,000 | Underlying Cause Years of Potential Life Lost in Thousands | Underlying or Other Cause Number of Deaths | Underlying or Other Cause Rate per 100,000 |
|---|---|---|---|---|---|
| AGE (Years) Under 15 |
— | — | — | — | — |
| AGE (Years) 15–44 |
6 | 0.0 | 0.2 | 13 | 0.0 |
| AGE (Years) 45–64 |
27 | 0.0 | 0.6 | 61 | 0.1 |
| AGE (Years) 65+ |
25 | 0.1 | 0.0 | 55 | 0.2 |
| Race White |
48 | 0.0 | 0.7 | 101 | 0.0 |
| Race Black |
7 | 0.0 | 0.1 | 20 | 0.1 |
| Sex Female |
28 | 0.0 | 0.3 | 57 | 0.0 |
| Sex Male |
30 | 0.0 | 0.5 | 72 | 0.0 |
| Total | 58 | 0.0 | 0.8 | 129 | 0.0 |
Figure 2. Hepatitis A: Age-Adjusted Rates of Death in the United States, 1979–2004
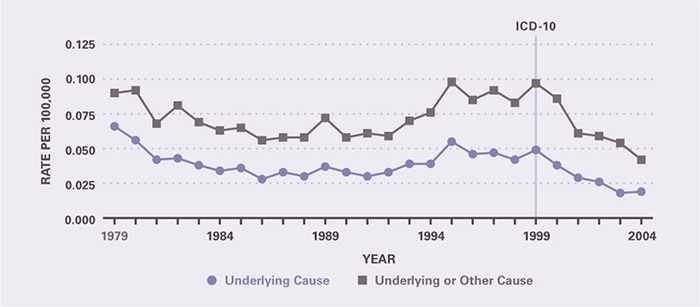
Table 3.Hepatitis B: Number and Age-Adjusted Rates of Ambulatory Care Visits and Hospital Discharges With First-Listed and All-Listed Diagnoses by Age, Race, and Sex in the United States, 2004
| Demographic Characteristics | Ambulatory Care Visits First-Listed Diagnosis Number in Thousands | Ambulatory Care Visits First-Listed Diagnosis Rate per 100,000 | Ambulatory Care Visits All-Listed Diagnosis Number in Thousands | Ambulatory Care Visits All-Listed Diagnosis Rate per 100,000 | Hospital Discharges First-Listed Diagnosis Number in Thousands | Hospital Discharges First-Listed Diagnosis Rate per 100,000 | Hospital Discharges All-Listed Diagnosis Number in Thousands | Hospital Discharges All-Listed Diagnosis Rate per 100,000 |
|---|---|---|---|---|---|---|---|---|
| AGE (Years) Under 15 |
— | — | — | — | — | — | — | — |
| AGE (Years) 15–44 |
— | — | 385 | 306 | 2 | 1 | 26 | 21 |
| AGE (Years) 45–64 |
— | — | 277 | 392 | 1 | 2 | 33 | 47 |
| AGE (Years) 65+ |
— | — | — | — | 0 | 1 | 9 | 26 |
| Race White |
— | — | 242 | 98 | 2 | 1 | 40 | 16 |
| Race Black |
— | — | 183 | 510 | 1 | 3 | 19 | 55 |
| Sex Female |
— | — | 122 | 83 | 1 | 1 | 26 | 17 |
| Sex Male |
— | — | 607 | 418 | 2 | 1 | 43 | 29 |
| Total | 448 | 152 | 729 | 248 | 4 | 1 | 69 | 23 |
Figure 3. Hepatitis B: Age-Adjusted Rates of Ambulatory Care Visits and Hospital Discharges With All–Listed Diagnoses in the United States, 1979–2004
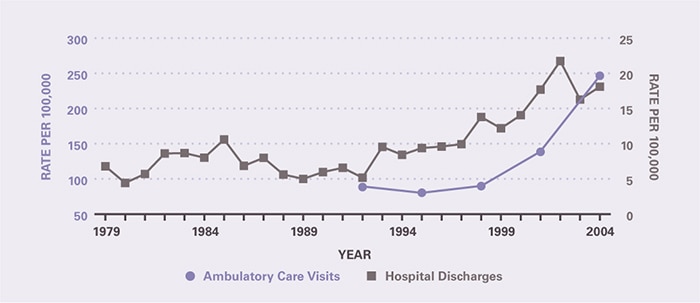
Table 4. Hepatitis B: Number and Age-Adjusted Rates of Deaths and Years of Potential Life Lost (to Age 75) by Age, Race, and Sex in the United States, 2004
| Demographic Characteristics | Underlying Cause Number of Deaths | Underlying Cause Rate per 100,000 | Underlying Cause Years of Potential Life Lost in Thousands | Underlying or Other Cause Number of Deaths | Underlying or Other Cause Rate per 100,000 |
|---|---|---|---|---|---|
| AGE (Years) Under 15 |
— | — | — | 1 | 0.0 |
| AGE (Years) 15–44 |
115 | 0.1 | 4.2 | 291 | 0.2 |
| AGE (Years) 45–64 |
346 | 0.5 | 7.1 | 962 | 1.4 |
| AGE (Years) 65+ |
184 | 0.5 | 0.5 | 441 | 1.2 |
| Race White |
424 | 0.2 | 7.6 | 984 | 0.4 |
| Race Black |
124 | 0.4 | 2.5 | 390 | 1.2 |
| Sex Female |
174 | 0.1 | 2.7 | 428 | 0.3 |
| Sex Male |
471 | 0.3 | 9.1 | 1,267 | 0.9 |
| Total | 645 | 0.2 | 11.8 | 1,695 | 0.6 |
Figure 4. Hepatitis B: Age-Adjusted Rates of Death in the United States, 1979–2004
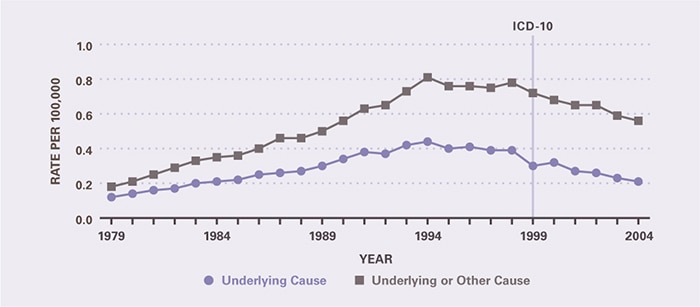
Table 5. Hepatitis C: Number and Age-Adjusted Rates of Ambulatory Care Visits and Hospital Discharges With First-Listed and All-Listed Diagnoses by Age, Race, and Sex in the United States, 2004
| Demographic Characteristics | Ambulatory Care Visits First-Listed Diagnosis Number in Thousands | Ambulatory Care Visits First-Listed Diagnosis Rate per 100,000 | Ambulatory Care Visits All-Listed Diagnosis Number in Thousands | Ambulatory Care Visits All-Listed Diagnosis Rate per 100,000 | Hospital Discharges First-Listed Diagnosis Number in Thousands | Hospital Discharges First-Listed Diagnosis Rate per 100,000 | Hospital Discharges All-Listed Diagnosis Number in Thousands | Hospital Discharges All-Listed Diagnosis Rate per 100,000 |
|---|---|---|---|---|---|---|---|---|
| AGE (Years) Under 15 |
— | — | — | — | — | — | 0 | 0 |
| AGE (Years) 15–44 |
382 | 304 | 791 | 628 | 2 | 2 | 127 | 101 |
| AGE (Years) 45–64 |
918 | 1,298 | 1,603 | 2,268 | 7 | 10 | 248 | 351 |
| AGE (Years) 65+ |
— | — | 353 | 970 | 1 | 4 | 43 | 118 |
| Race White |
1,110 | 451 | 1,828 | 742 | 9 | 3 | 298 | 120 |
| Race Black |
235 | 662 | 739 | 2,122 | 2 | 5 | 99 | 286 |
| Sex Female |
514 | 331 | 925 | 604 | 4 | 3 | 161 | 105 |
| Sex Male |
974 | 677 | 1,823 | 1,261 | 7 | 4 | 258 | 176 |
| Total | 1,487 | 506 | 2,747 | 936 | 11 | 4 | 419 | 143 |
Figure 5. Hepatitis C: Age-Adjusted Rates of Ambulatory Care Visits and Hospital Discharges With All–Listed Diagnoses in the United States, 1979–2004
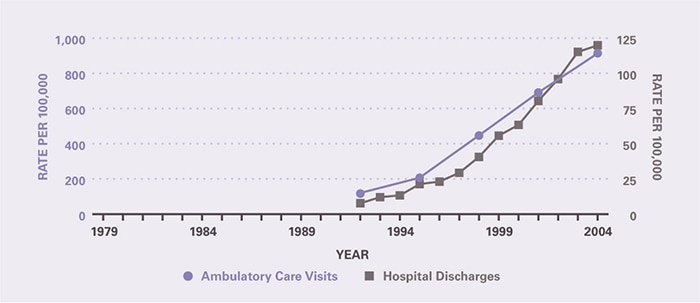
Table 6. Hepatitis C: Number and Age-Adjusted Rates of Deaths and Years of Potential Life Lost (to Age 75) by Age, Race, and Sex in the United States, 2004
| Demographic Characteristics | Underlying Cause Number of Deaths | Underlying Cause Rate per 100,000 | Underlying Cause Years of Potential Life Lost in Thousands | Underlying or Other Cause Number of Deaths | Underlying or Other Cause Rate per 100,000 |
|---|---|---|---|---|---|
| AGE (Years) Under 15 |
2 | 0.0 | 0.1 | 3 | 0.0 |
| AGE (Years) 15–44 |
547 | 0.4 | 18.6 | 1,445 | 1.1 |
| AGE (Years) 45–64 |
3,062 | 4.3 | 66.1 | 7,590 | 10.7 |
| AGE (Years) 65+ |
984 | 2.7 | 2.7 | 2,253 | 6.2 |
| Race White |
3,712 | 1.4 | 71.0 | 8,771 | 3.4 |
| Race Black |
718 | 2.2 | 14.2 | 2,111 | 6.4 |
| Sex Female |
1,625 | 1.0 | 26.8 | 3,448 | 2.2 |
| Sex Male |
2,970 | 2.0 | 60.8 | 7,844 | 5.3 |
| Total | 4,595 | 1.6 | 87.5 | 11,292 | 3.8 |
Figure 6. Hepatitis C: Age-Adjusted Rates of Death in the United States, 1979–2004
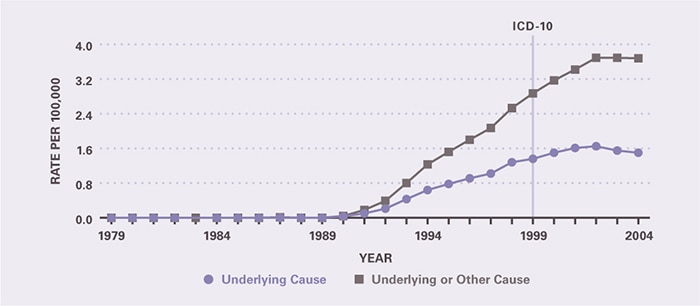
Table 7. All Viral Hepatitis: Number and Age-Adjusted Rates of Ambulatory Care Visits and Hospital Discharges With First-Listed and All-Listed Diagnoses by Age, Race, and Sex in the United States, 2004
| Demographic Characteristics | Ambulatory Care Visits First-Listed Diagnosis Number in Thousands | Ambulatory Care Visits First-Listed Diagnosis Rate per 100,000 | Ambulatory Care Visits All-Listed Diagnosis Number in Thousands | Ambulatory Care Visits All-Listed Diagnosis Rate per 100,000 | Hospital Discharges First-Listed Diagnosis Number in Thousands | Hospital Discharges First-Listed Diagnosis Rate per 100,000 | Hospital Discharges All-Listed Diagnosis Number in Thousands | Hospital Discharges All-Listed Diagnosis Rate per 100,000 |
|---|---|---|---|---|---|---|---|---|
| AGE (Years) Under 15 |
— | — | — | — | 1 | 1 | 1 | 2 |
| AGE (Years) 15–44 |
627 | 499 | 1,174 | 933 | 6 | 5 | 150 | 119 |
| AGE (Years) 45–64 |
1,118 | 1,582 | 1,914 | 2,708 | 10 | 14 | 271 | 383 |
| AGE (Years) 65+ |
— | — | 399 | 1,099 | 2 | 6 | 53 | 147 |
| Race White |
1,260 | 509 | 2,101 | 852 | 14 | 6 | 330 | 133 |
| Race Black |
315 | 869 | 919 | 2,625 | 3 | 9 | 113 | 326 |
| Sex Female |
620 | 404 | 1,071 | 703 | 8 | 5 | 185 | 121 |
| Sex Male |
1,356 | 936 | 2,439 | 1,685 | 11 | 7 | 290 | 198 |
| Total | 1,977 | 673 | 3,510 | 1,195 | 19 | 6 | 475 | 162 |
Figure 7. All Viral Hepatitis: Age-Adjusted Rates of Ambulatory Care Visits and Hospital Discharges With All–Listed Diagnoses in the United States, 1979–2004
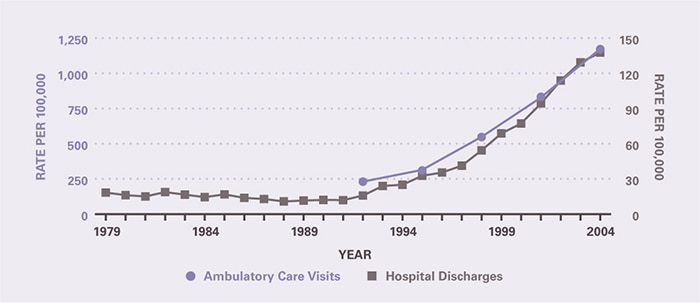
Table 8. All Viral Hepatitis: Number and Age-Adjusted Rates of Deaths and Years of Potential Life Lost (to Age 75) by Age, Race, and Sex in the United States, 2004
| Demographic Characteristics | Underlying Cause Number of Deaths | Underlying Cause Rate per 100,000 | Underlying Cause Years of Potential Life Lost in Thousands | Underlying or Other Cause Number of Deaths | Underlying or Other Cause Rate per 100,000 |
|---|---|---|---|---|---|
| AGE (Years) Under 15 |
3 | 0.0 | 0.2 | 9 | 0.0 |
| AGE (Years) 15–44 |
684 | 0.5 | 23.7 | 1,674 | 1.3 |
| AGE (Years) 45–64 |
3,477 | 4.9 | 74.7 | 8,249 | 11.7 |
| AGE (Years) 65+ |
1,229 | 3.4 | 3.2 | 2,723 | 7.5 |
| Race White |
4,254 | 1.7 | 80.4 | 9,538 | 3.7 |
| Race Black |
866 | 2.6 | 17.1 | 2,401 | 7.3 |
| Sex Female |
1,872 | 1.2 | 30.5 | 3,850 | 2.4 |
| Sex Male |
3,521 | 2.4 | 71.3 | 8,806 | 6.0 |
| Total | 5,393 | 1.8 | 101.8 | 12,656 | 4.3 |
Figure 8. All Viral Hepatitis: Age-Adjusted Rates of Death in the United States, 1979–2004
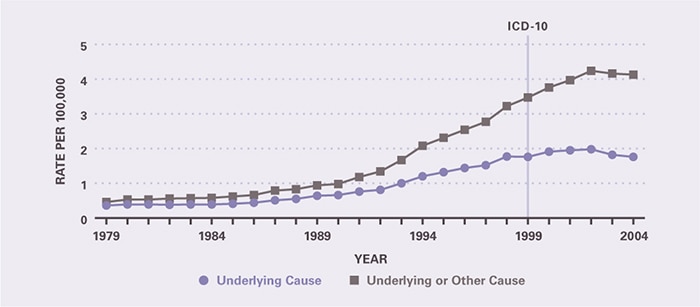
Table 9. All Viral Hepatitis: Costliest Prescriptions
| DRUG | Prescription (#) | Prescription | Retail Cost | Cost |
|---|---|---|---|---|
| Ribavirin | 221,035 | 34.7% | $229,351,616 | 40.0% |
| Peginterferon alfa-2a | 131,001 | 20.5 | 191,754,177 | 33.5 |
| Peginterferon alfa-2b | 64,398 | 10.1 | 84,943,979 | 14.8 |
| Adefovir | 86,784 | 13.6 | 43,120,493 | 7.5 |
| Lamivudine | 134,657 | 21.1 | 23,580,159 | 4.2 |
| Total | 637,875 | 100.0% | $572,750,424 | 100.0% |