About Our Research
The purpose of our research is to understand how mutations of PKD genes cause polycystic kidney disease.
PKD is one of the most common, serious mendelian disorders of man and causes 4-5 percent of all end stage kidney disease in the United States. Affected individuals also suffer from other complications such as hypertension, cyst infections, abdominal pain, and have an increased risk of intracranial aneurysms. Present management is focused on treating symptoms. Understanding the mechanisms of disease will allow us to develop safe and effective treatments.
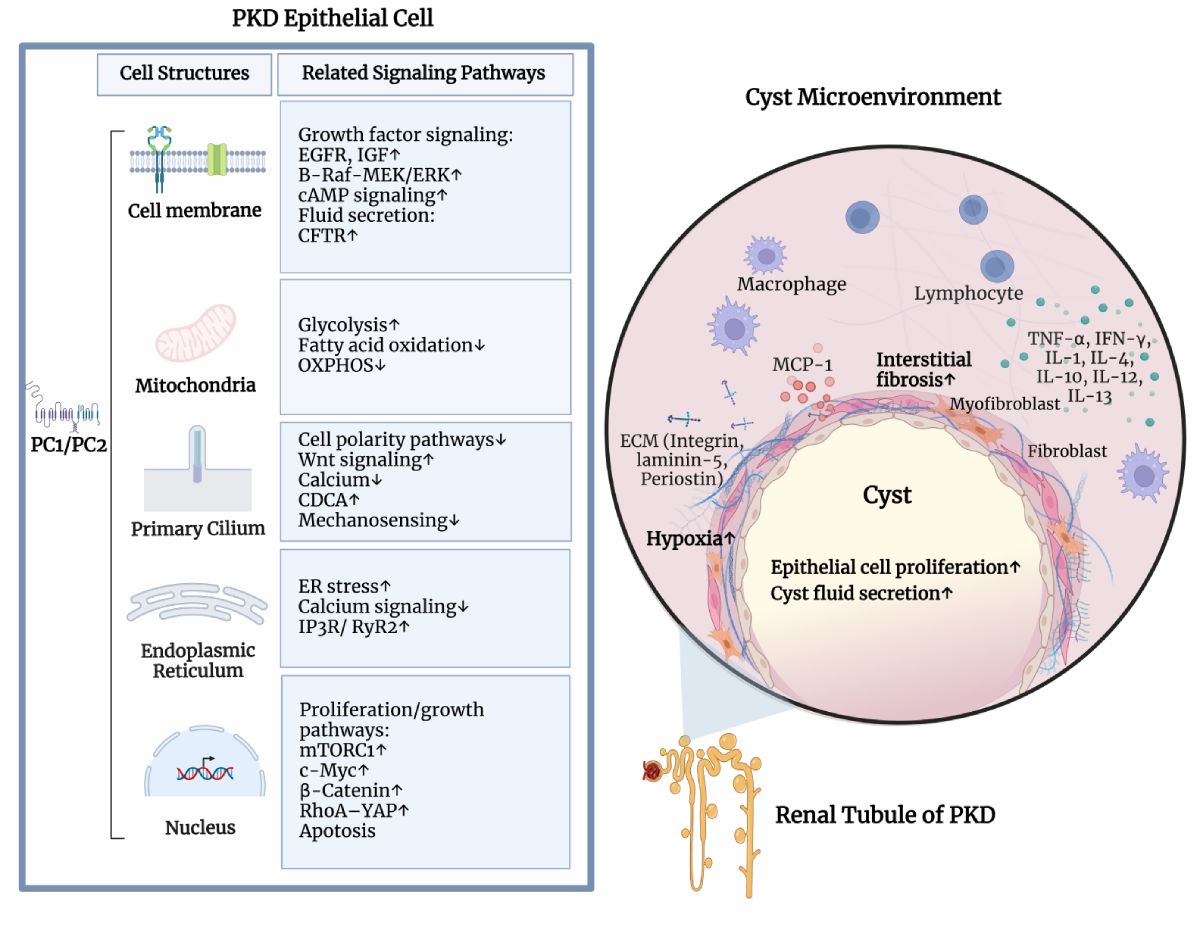
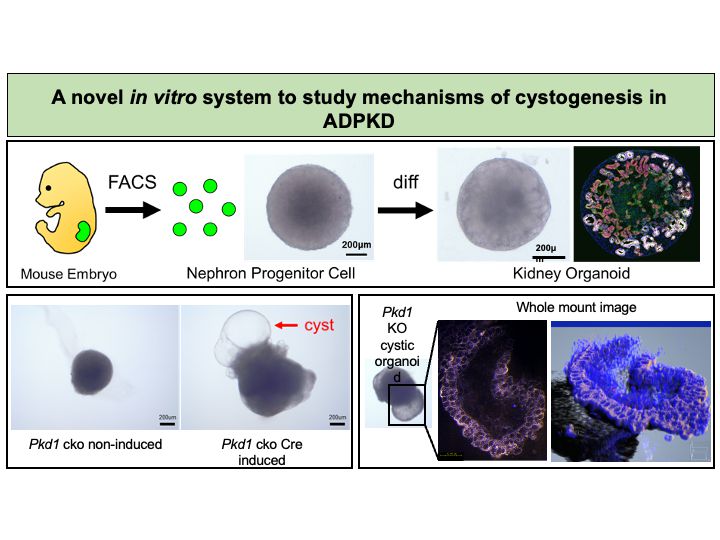
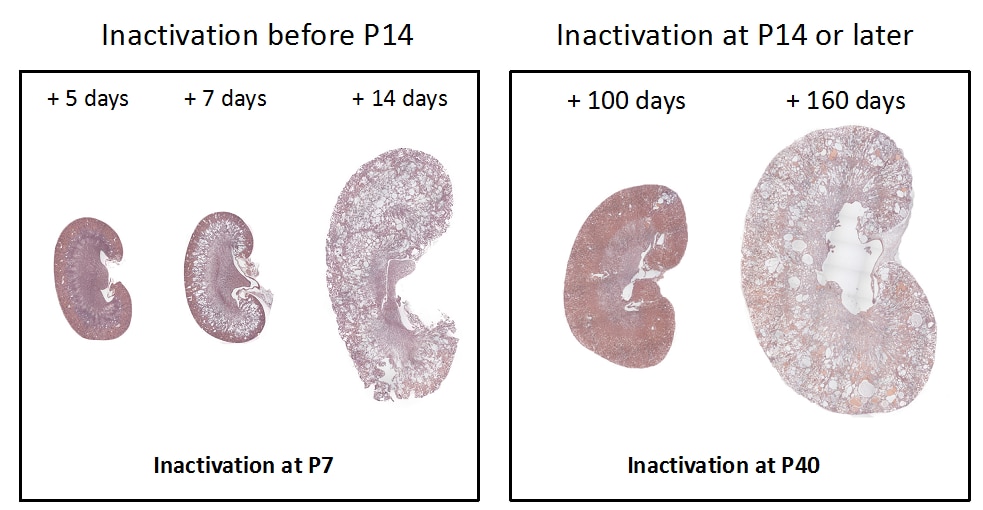
While the PKD gene products polycystin 1 (PC1) and polycystin 2 (PC2) are essential for establishing and maintaining normal tubule structure, we do not know how they do this. Several lines of evidence suggest that they function as a receptor-channel complex, but what they sense and signal is poorly understood. Though numerous pathways have been reported to be dysregulated in cystic epithelia, it is unclear how these link back to the function of the PC1/PC2 complex, which pathways are dysregulated at the earliest stages of cyst formation, and which are altered as secondary consequence of cystic dilations. We also do not understand why cysts form immediately after gene inactivation in young mice but take months to arise in older animals. What factors preserve tubular structure during this interval, and what triggers the subsequent failure? Understanding these processes is important not only from a pathobiological standpoint, but also to design more specific therapies. We also need better tools for assessing the progression of disease so we can better evaluate the effectiveness of clinical interventions.
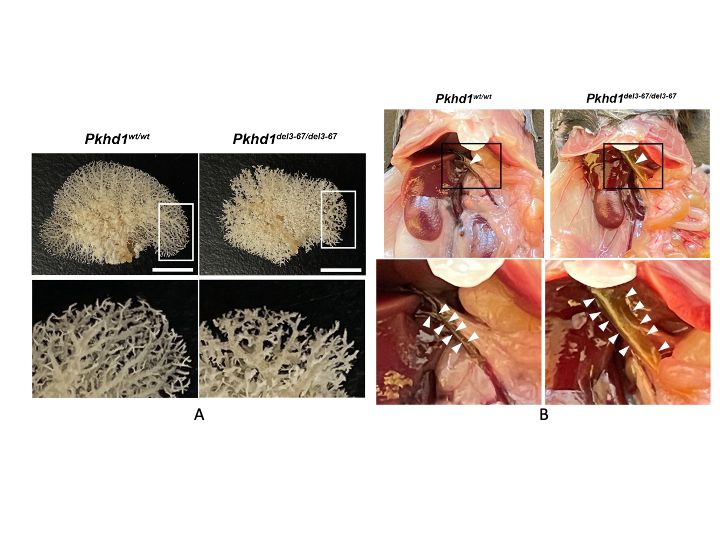
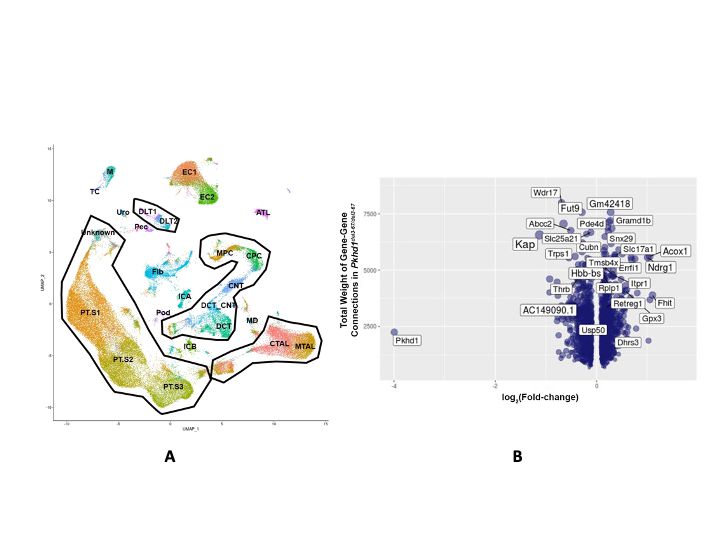
Research Images
A critical developmental switch determines kinetics of cyst formation
Cysts form within days if Pkd1 is inactivated at post-natal (P) day 13 (on left) or before but takes months if at P14 or later (on right). In the example on the left, Pkd1flox/flox;Esr1-Cre mice were treated with tamoxifen at P7 and kidneys harvested 5, 7 or 14 days later. Cysts are visible 5 days later and increase in size and number over the next 9 days. In the right panel, Pkd1flox/flox;Esr1-Cre were treated with tamoxifen at P40 and even 100 days later the kidneys appear normal. Cysts typically begin forming at around 120 days and grow rapidly thereafter. From Piontek et al, Nature Med 13:1490-5, 2007.
Sex is a major determinant of disease progression and gene expression profiles in a mouse model of human autosomal dominant polycystic kidney disease.
a) Kidney to body weight ratios (KBW) plotted over time shows more rapid and severe kidney disease in male mice. b) Representative kidney histology of mutant and control male and female mice showing cystic mutant male and less affected littermate mutant female. This panel shows the remarkable finding that the number of genes differentially expressed between normal male and female kidneys is almost the same as between normal and cystic kidney. c) Multidimensional scaling (MDS) plot representing similarity in gene expression patterns between samples shows that sex and cystic stage are responsible for most of the difference. Each dot corresponds to one kidney (size: correlates with KBW). d) Heatmap plot showing patterns of gene expression between male and female control kidneys. The dendogram on the top shows that the expression pattern of these genes can separate male and female kidneys. From Menezes et al, EBioMedicine. 2016 Jan 26;5:183-92.
Mouse and human PKD cells and Tissues Have Abnormal Mitochondria.
a) Electron microscopy showing swollen mitochondria, some with darkly stained membranous whorls, in a Pkd1 mutant cell line. b) Swollen mitochondria in Pkd1 mutant cells freshly dissociated from cystic and control mouse kidneys. Panels on the right show higher magnification of the areas inside the white squares. c) Quantification of number of “normal” or “aberrant” mitochondria in randomly selected fields of the samples shown in (a and b); n ≥ 29 fields/condition, p < 0.001. d) Swollen mitochondria in ADPKD human kidney samples. Panels on the right show higher magnification of the areas inside the white squares. Representative aberrant mitochondria are indicated with magenta arrowheads. Adapted from Lin et al, Sci Rep. 2018 Feb 9:8(1):2743.
The C-terminus of Polycystin-1 (PC1-CTT) is a mitochondrial matrix protein that affects mitochondria morphology and function when heterologously expressed.
a) Schematics showing PC1 domains and predicted topology. Full-length PC1 (FL) is a 4,302-aa protein with 11 predicted transmembrane (TM) domains. N-terminal to the first TM, a G-protein-coupled receptor cleavage site (GPS) undergoes autocatalytic cleavage to produce 3,048-aa N-terminal (NFT; ~325 kDa) and 1,254-aa C-terminal fragments (CTF; ~150 kDa) that remain non-covalently associated. The CTF can be further processed to release a cytoplasmic tail (CTT). b) A subset of NIH3T3 cells expressing recombinant mCherry-PKD1-eGFP show NTF localized to the ER and CTF (CTT) in mitochondria. Mitochondria are stained with Mitotracker Deep Red (Mito), a marker for mitochondria. c) Expression of the PC1-CTT corrects the fragmented mitochondrial network structure of Pkd1 mutant epithelial cells. In this example, mutant cells expressing EGP targeted to the mitochondria (MTS-eGFP, negative control) have a fragmented structure whereas cells expressing recombinant PC1-CTT have more elongated mitochondria. Mitochondria are stained with Mitotracker Deep Red (Mito). d) Cumulative density of solidity index in at least three independent experiments in three different mutant cell lines. Note that cells expressing PC1-CTT have solidity distribution shifted towards lower values, indicating less fragmentation of the network structure. Each line corresponds to one experiment, colored by cell line.Adapted from Lin et al, Sci Rep. 2018 Feb 9:8(1):2743.
Hnf4α is a disease modifier
Network pathway analysis suggests that HNF4α is a node in gene networks of polycystic kidney disease (left). Kidney histology is also depicted and is confirming a modifier effect of Hnf4α in the severity of Pkd1cystogenesis (right). Note the left kidney, in which Pkd1 and Hnf4α are deleted, has more and larger cyststhan the kidney in which only Pkd1 was deleted.
Genomics and Metabolomics of Polycystic Kidney Disease
A heatmap plot showing that a subset of differentially expressed genes separates mutant and control kidneys in both pre-cystic (P12) and cystic (P14) kidneys (left) and a Principal Component Plot showing that the pattern of metabolites expressed in the urine of control and cystic animals is different, consistent with our gene array data (right).
Fatty acid oxidation is impaired in cells lacking PC1.
Oxygen consumption rate (OCR) in several pairs of matched cell lines that differ only by either expressing PC1 (control; red) or lacking PC1 (mutant; green), when palmitate is used as a substrate. Note that OCR is lower in mutants for every pair, indicating that cells lacking PC1 have impaired fatty acid oxidation.
PC1-CTT is enriched in mitochondria
Fluorescence imaging in live cells expressing only eGFP (control; top left panel) or PC1 C-terminal tail (PC1-CCT) fused with eGFP (lower left panel). The middle panels delineate mitochondria using a mitochondrial marker. The right panels show the mitochondrial marker in magenta and eGFP in green. Note that PC1-CTT and mitochondria are co-localized.