Chapter 5: Cancer of the Esophagus
James E. Everhart, M.D., M.P.H.
The two forms of esophageal cancer are squamous cell carcinoma, which occurs in the upper two-thirds of the esophagus, and adenocarcinoma, which occurs in the lower part of the esophagus. Because the epidemiology of the two cancers is quite different, the SEER results are presented separately. Other national data sources do not differentiate as well, and those data therefore are combined.
In 2004, the majority (67 percent) of new cases of esophageal squamous cell cancer occurred among persons 65 years and older (Table 1) and occurred most often among non-Hispanic blacks and males (61 percent). The incidence declined over 25 years to 2004, when it was about half the rate of 1979 (Figure 1). Five-year survival remained poor, but improved from about 3 percent to 12 percent over that period.
Esophageal adenocarcinoma had a younger age distribution than most other digestive system cancers, but the majority of cases (63 percent) still occurred at age 65 years and older (Table 2). Non-Hispanic whites and males had by far the highest risk. These race and sex differences were greater than for any other common digestive tract cancer. During the 25 years of observation, the incidence of esophageal adenocarcinoma increased more rapidly than any other common malignancy, rising approximately fivefold between 1979 and 2004 (Figure 2). Five-year survival remained poor, but had increased from less than 5 percent to more than 15 percent.
Combining the two esophageal cancers (Table 3 and Figure 3) obscures their dynamic differences. For example, incidence of all esophageal cancer increased modestly over the period, but in 1979, adenocarcinoma was about one-eighth as frequent as squamous cell carcinoma, whereas by 2004, adenocarcinoma had the higher incidence. These combined data can, however, be useful for comparison with other national data. In 2004, there were an estimated 372,000 ambulatory care visits and 44,000 hospital diagnoses for esophageal cancer; rates of ambulatory care visits were moderately higher among persons age 65 years and older (Table 4). There were only sufficient numbers of ambulatory care visits for whites and males to show in the table. Hospitalizations occurred predominantly among persons age 65 years and older. During the 25 years of reporting, the rates of hospitalization remained relatively stable, in keeping with the overall incidence figures (Figure 4). Ambulatory care visits were too uncommon to discern a trend.
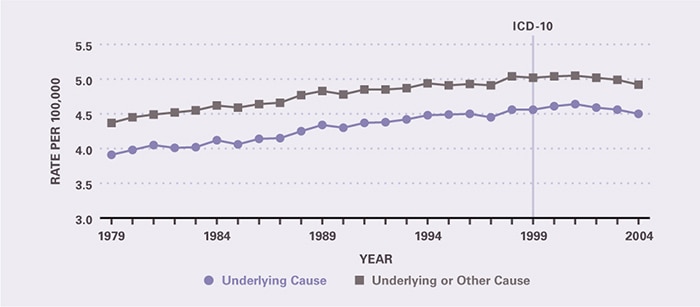
Esophageal cancer was a frequent cause of cancer death, ranking third in 2004 among digestive system cancers (after colorectal and pancreatic cancer) and was responsible for more than 13,000 deaths (Table 5) and 113,000 YPLL prior to age 75 years. Cancers of the gastroesophageal junction and cardia accounted for 4.6 percent of these deaths (see Chapter 6, Cancer of the Stomach). In keeping with the SEER data, death rates were highest among persons age 65 years and older, blacks (modestly more than whites), and males. Death rates increased between 1979 and 2004, but not during the last 6 years of that period.
Table 1. Esophageal Squamous Cell Cancer: Number of Cases and Incidence Rates by Age, Race/Ethnicity, and Sex, 2004
| Demographic Characteristics | Number of Cases | Incidence per 100,000 Unadjusted | Incidence per 100,000 Age-Adjusted |
|---|---|---|---|
| AGE (Years) Under 15 |
— | — | — |
| AGE (Years) 15–44 |
94 | 0.1 | — |
| AGE (Years) 45–64 |
1,655 | 2.4 | — |
| AGE (Years) 65+ |
3,093 | 9.0 | — |
| RACE/ETHNICITY Non-Hispanic White |
3,183 | 1.7 | 1.4 |
| RACE/ETHNICITY Non-Hispanic Black |
1,108 | 3.2 | 4.4 |
| RACE/ETHNICITY Hispanic |
263 | 0.7 | 1.4 |
| RACE/ETHNICITY Asian/Pacific Islander |
210 | 1.7 | 2.0 |
| RACE/ETHNICITY American Indian/Alaska Native |
— | — | — |
| Sex Female |
1,771 | 1.2 | 1.2 |
| Sex Male |
2,828 | 2.0 | 2.4 |
| Total | 4,612 | 1.6 | — |
Figure 1. Esophageal Squamous Cell Cancer: Age-Adjusted Incidence Rates and 5-Year Survival Rates, 1979–2004
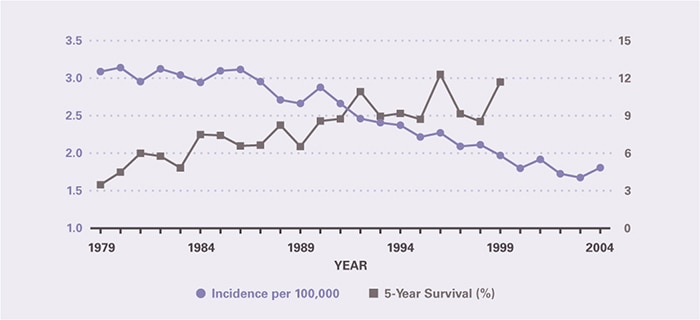
Table 2. Esophageal Adenocarcinoma: Number of Cases and Incidence Rates by Age, Race/Ethnicity, and Sex, 2004
| Demographic Characteristics | Number of Cases | Incidence per 100,000 Unadjusted | Incidence per 100,000 Age-Adjusted |
|---|---|---|---|
| AGE (Years) Under 15 |
— | — | — |
| AGE (Years) 15–44 |
198 | 0.2 | — |
| AGE (Years) 45–64 |
2,420 | 3.5 | — |
| AGE (Years) 65+ |
3,996 | 11.7 | — |
| RACE/ETHNICITY Non-Hispanic White |
6,553 | 3.4 | 2.9 |
| RACE/ETHNICITY Non-Hispanic Black |
143 | 0.4 | 0.5 |
| RACE/ETHNICITY Hispanic |
268 | 0.7 | 1.4 |
| RACE/ETHNICITY Asian/Pacific Islander |
54 | 0.4 | 0.5 |
| RACE/ETHNICITY American Indian/Alaska Native |
— | — | — |
| Sex Female |
942 | 0.6 | 0.6 |
| Sex Male |
5,318 | 3.8 | 4.5 |
| Total | 6,309 | 2.2 | — |
Figure 2. Esophageal Adenocarcinoma: Age-Adjusted Incidence Rates and 5-Year Survival Rates, 1979–2004
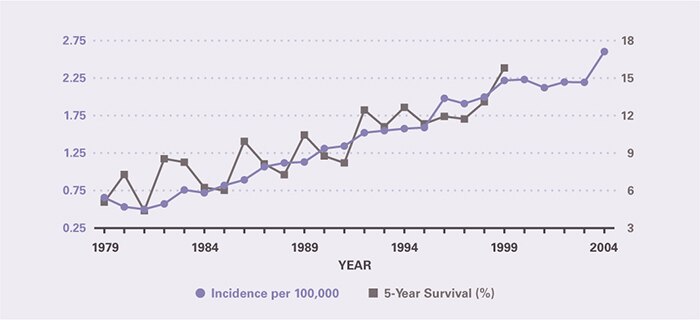
Table 3. All Esophageal Cancer: Number of Cases and Incidence Rates by Age, Race/Ethnicity, and Sex, 2004
| Demographic Characteristics | Number of Cases | Incidence per 100,000 Unadjusted | Incidence per 100,000 Age-Adjusted |
|---|---|---|---|
| AGE (Years) Under 15 |
— | — | — |
| AGE (Years) 15–44 |
367 | 0.3 | — |
| AGE (Years) 45–64 |
4,712 | 6.7 | — |
| AGE (Years) 65+ |
8,411 | 24.6 | — |
| RACE/ETHNICITY Non-Hispanic White |
11,572 | 6.0 | 5.1 |
| RACE/ETHNICITY Non-Hispanic Black |
1,394 | 4.1 | 5.5 |
| RACE/ETHNICITY Hispanic |
638 | 1.6 | 3.4 |
| RACE/ETHNICITY Asian/Pacific Islander |
299 | 2.4 | 2.9 |
| RACE/ETHNICITY American Indian/Alaska Native |
— | — | — |
| Sex Female |
3,186 | 2.2 | 2.1 |
| Sex Male |
9,605 | 6.9 | 8.1 |
| Total | 12,863 | 4.5 | — |
Figure 3. All Esophageal Cancer: Age-Adjusted Incidence Rates and 5-Year Survival Rates, 1979–2004
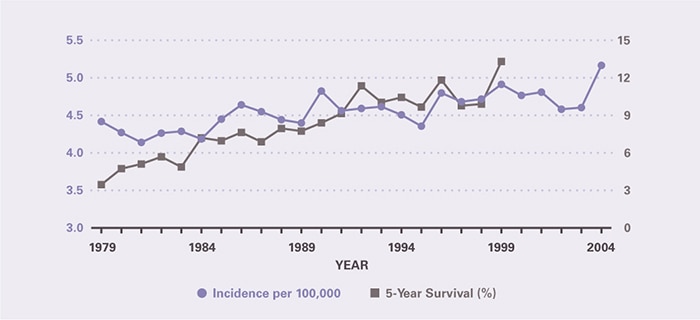
Table 4. All Esophageal Cancer: Number and Age-Adjusted Rates of Ambulatory Care Visits and Hospital Discharges With First-Listed and All-Listed Diagnoses by Age, Race, and Sex in the United States, 2004
| Demographic Characteristics | Ambulatory Care Visits First-Listed Diagnosis Number in Thousands | Ambulatory Care Visits First-Listed Diagnosis Rate per 100,000 | Ambulatory Care Visits All-Listed Diagnosis Number in Thousands | Ambulatory Care Visits All-Listed Diagnosis Rate per 100,000 | Hospital Discharges First-Listed Diagnosis Number in Thousands | Hospital Discharges First-Listed Diagnosis Rate per 100,000 | Hospital Discharges All-Listed Diagnosis Number in Thousands | Hospital Discharges All-Listed Diagnosis Rate per 100,000 |
|---|---|---|---|---|---|---|---|---|
| AGE (Years) Under 15 |
— | — | — | — | — | — | — | — |
| AGE (Years) 15–44 |
— | — | — | — | 1 | 1 | 2 | 2 |
| AGE (Years) 45–64 |
215 | 304 | 217 | 308 | 8 | 11 | 17 | 25 |
| AGE (Years) 65+ |
138 | 379 | 150 | 413 | 11 | 30 | 25 | 69 |
| Race White |
343 | 131 | 361 | 139 | 16 | 6 | 36 | 14 |
| Race Black |
— | — | — | — | 2 | 8 | 6 | 19 |
| Sex Female |
— | — | — | — | 5 | 3 | 10 | 6 |
| Sex Male |
244 | 170 | 261 | 184 | 15 | 11 | 34 | 26 |
| Total | 354 | 120 | 372 | 127 | 20 | 7 | 44 | 15 |
Figure 4. All Esophageal Cancer: Age-Adjusted Rates of Ambulatory Care Visits and Hospital Discharges With All–Listed Diagnoses in the United States, 1979–2004
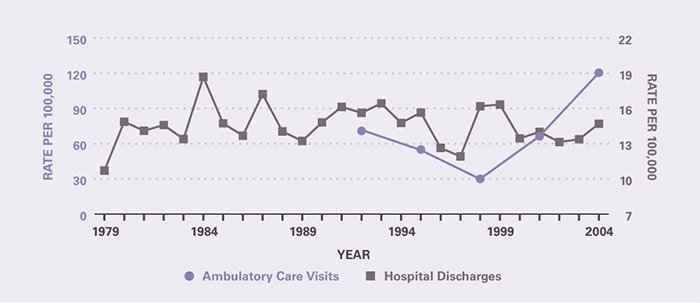
Table 5. All Esophageal Cancer: Number and Age-Adjusted Rates of Deaths and Years of Potential Life Lost (to Age 75) by Age, Race, and Sex in the United States, 2004
| Demographic Characteristics | Underlying Cause Number of Deaths | Underlying Cause Rate per 100,000 | Underlying Cause Years of Potential Life Lost in Thousands | Underlying or Other Cause Number of Deaths | Underlying or Other Cause Rate per 100,000 |
|---|---|---|---|---|---|
| AGE (Years) Under 15 |
— | — | — | — | — |
| AGE (Years) 15–44 |
371 | 0.3 | 12.9 | 388 | 0.3 |
| AGE (Years) 45–64 |
4,650 | 6.6 | 82.6 | 4,929 | 7.0 |
| AGE (Years) 65+ |
8,646 | 23.8 | 18.4 | 9,610 | 26.4 |
| Race White |
11,850 | 4.6 | 94.6 | 12,953 | 5.0 |
| Race Black |
1,561 | 5.5 | 17.0 | 1,696 | 6.0 |
| Sex Female |
3,063 | 1.8 | 18.5 | 3,361 | 2.0 |
| Sex Male |
10,604 | 8.1 | 95.4 | 11,566 | 8.9 |
| Total | 13,667 | 4.7 | 113.8 | 14,927 | 5.1 |
Figure 5. All Esophageal Cancer: Age-Adjusted Rates of Death in the United States, 1979–2004