

Chapter 23: Pancreatitis
James E. Everhart, M.D., M.P.H.
Pancreatitis is coded as acute or chronic, and the two are grouped together in this chapter, although acute pancreatitis has the greater burden of medical care and mortality.25 In 2004, there were 475,000 ambulatory care visits as first-listed diagnosis and 881,000 visits as all-listed diagnoses (Table 1). Rates of visits with pancreatitis as all-listed diagnoses increased moderately with age. Age-adjusted rates were 25 percent higher among blacks than whites and 52 percent higher among females than males. Pancreatitis was the seventh most commonly noted digestive disease diagnosis on hospitalization, just after peptic ulcer disease. Hospitalization rates increased with age and were 88 percent higher among blacks and 11 percent higher among males. Rates of both ambulatory care visits and hospitalizations with pancreatitis increased from the 1980s to 2004 (Figure 1). In particular, the rate of hospital discharges with a pancreatitis diagnosis increased 62 percent between 1988 and 2004.
In 2004, pancreatitis was the eleventh most common underlying cause of death from digestive diseases and the fifth most common nonmalignant cause, just after peptic ulcer disease. More than half of deaths occurred among persons age 65 years and older (Table 2).
Pancreatitis ranked eighth among all digestive diseases in YPLL prior to age 75, with about 43,000 years or 12.3 years per death. Death rates increased with age and were higher among blacks than whites and men than women. Mortality rates fell slightly from 1979 to 2004 (Figure 2), with the rate for underlying cause having fallen 15 percent over this 25-year period.
According to the Verispan database of retail pharmacy prescriptions (Appendix 2), in 2004, the total number of prescriptions for pancreatitis was approximately 766,000 at a retail cost of roughly $88.6 million (Table 3). Pancreatic enzyme replacements constituted 60.3 percent of the prescriptions and 84.8 percent of the cost. All the other prescriptions were analgesics or antiemetic agents.
References
Table 1. Pancreatitis: Number and Age-Adjusted Rates of Ambulatory Care Visits and Hospital Discharges With First-Listed and All-Listed Diagnoses by Age, Race, and Sex in the United States, 2004
| Demographic Characteristics | Ambulatory Care Visits First-Listed Diagnosis Number in Thousands | Ambulatory Care Visits First-Listed Diagnosis Rate per 100,000 | Ambulatory Care Visits All-Listed Diagnosis Number in Thousands | Ambulatory Care Visits All-Listed Diagnosis Rate per 100,000 | Hospital Discharges First-Listed Diagnosis Number in Thousands | Hospital Discharges First-Listed Diagnosis Rate per 100,000 | Hospital Discharges All-Listed Diagnosis Number in Thousands | Hospital Discharges All-Listed Diagnosis Rate per 100,000 |
|---|---|---|---|---|---|---|---|---|
| AGE (Years) Under 15 |
— | — | — | — | 3 | 5 | 5 | 8 |
| AGE (Years) 15–44 |
153 | 121 | 304 | 241 | 99 | 78 | 152 | 120 |
| AGE (Years) 45–64 |
219 | 310 | 354 | 500 | 104 | 147 | 171 | 242 |
| AGE (Years) 65+ |
101 | 279 | 222 | 611 | 72 | 197 | 127 | 349 |
| Race White |
396 | 160 | 721 | 294 | 194 | 78 | 318 | 128 |
| Race Black |
77 | 213 | 129 | 368 | 46 | 136 | 81 | 241 |
| Sex Female |
306 | 199 | 545 | 355 | 136 | 87 | 228 | 145 |
| Sex Male |
169 | 116 | 336 | 234 | 140 | 100 | 226 | 161 |
| Total | 475 | 162 | 881 | 300 | 277 | 94 | 454 | 155 |
Figure 1. Pancreatitis: Age-Adjusted Rates of Ambulatory Care Visits and Hospital Discharges With All–Listed Diagnoses in the United States, 1979–2004
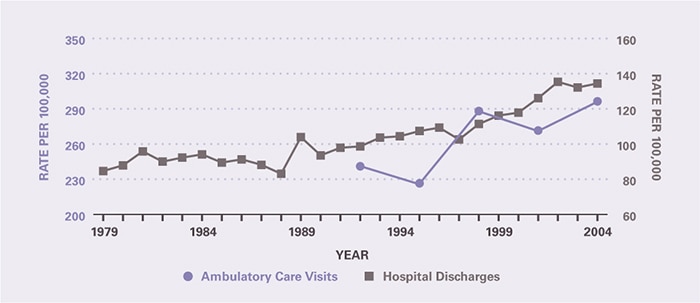
Table 2. Pancreatitis: Number and Age-Adjusted Rates of Deaths and Years of Potential Life Lost (to Age 75) by Age, Race, and Sex in the United States, 2004
| Demographic Characteristics | Underlying Cause Number of Deaths | Underlying Cause Rate per 100,000 | Underlying Cause Years of Potential Life Lost in Thousands | Underlying or Other Cause Number of Deaths | Underlying or Other Cause Rate per 100,000 |
|---|---|---|---|---|---|
| AGE (Years) Under 15 |
15 | 0.0 | 1.0 | 26 | 0.0 |
| AGE (Years) 15–44 |
467 | 0.4 | 17.8 | 888 | 0.7 |
| AGE (Years) 45–64 |
1,044 | 1.5 | 21.0 | 2,222 | 3.1 |
| AGE (Years) 65+ |
1,953 | 5.4 | 3.0 | 4,005 | 11.0 |
| Race White |
2,838 | 1.1 | 31.7 | 5,739 | 2.2 |
| Race Black |
557 | 1.8 | 9.7 | 1,210 | 4.0 |
| Sex Female |
1,549 | 0.9 | 13.0 | 3,239 | 1.9 |
| Sex Male |
1,931 | 1.5 | 29.8 | 3,903 | 3.0 |
| Total | 3,480 | 1.2 | 42.8 | 7,142 | 2.4 |
Figure 2. Pancreatitis: Age-Adjusted Rates of Death in the United States, 1979–2004
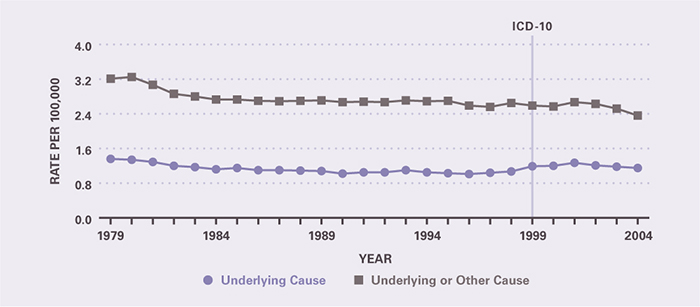
Table 3. Pancreatitis: Costliest Prescriptions
| DRUG | Prescription (#) | Prescription | Retail Cost | Cost |
|---|---|---|---|---|
| Amylase/Lipase/Protease | 343,519 | 44.8% | $54,085,858 | 61.1% |
| Pancrelipase | 118,277 | 15.4 | 21,041,841 | 23.8 |
| Hydrocodone/Acetaminophen | 171,121 | 22.3 | 6,524,330 | 7.4 |
| Oxycodone/Acetaminophen | 76,199 | 9.9 | 3,970,182 | 4.5 |
| Oxycodone | 25,097 | 3.3 | 2,629,763 | 3.0 |
| Promethazine | 20,846 | 2.7 | 184,599 | 0.2 |
| Codeine/Acetaminophen | 8,808 | 1.1 | 89,625 | 0.1 |
| Acetyl Salicylic Acid/Oxycodone | 964 | 0.1 | 30,971 | 0.0 |
| Meperidine | 1,139 | 0.1 | 21,709 | 0.0 |
| Prochlorperazine | 394 | 0.0 | 3,834 | 0.0 |
| Total | 766,364 | 100.0% | $88,582,712 | 100.0% |