Chapter 22: Gallstones
James E. Everhart, M.D., M.P.H.
Gallstones (cholelithiasis) are coded with or without complications (choledocholithiasis, cholangitis, cholecystitis). Cholecystitis (inflammation of the gallbladder) without the presence of gallstones was not included (Appendix 1).
In 2004, there were an estimated 1.8 million ambulatory care visits with a diagnosis of gallstones, most of which were for gallstones as a first-listed diagnosis (Table 1). Visit rates increased with age, although only modestly after age 65 years. Age-adjusted rates for any visits were 18 percent higher among whites than blacks and 162 percent higher for females than males, which is in keeping with the known risks for gallstones. Gallstones ranked fifth among digestive diseases in all-listed discharge diagnoses in 2004. However, this was an underestimate of the actual hospital burden, because most hospitalizations with gallstones were for cholecystectomy, of which a high proportion were performed laparoscopically without overnight stay and, therefore, not included in hospitalization statistics.22 Based on hospitalization rates prior to this shift in hospital care, gallstones would have ranked first among digestive diseases in first-listed diagnoses and second in all-listed (the first being GERD). Hospitalization rates with mention of gallstones increased with age, were similar for blacks and whites, and were 58 percent higher for women than men. Over time, rates of ambulatory care visits were relatively stable (Figure 1), but increased from the 1980s by at least 20 percent.23 Hospitalization rates dropped by 40 percent in 2004 from their peak in 1991, because of the aforementioned change in hospital care.
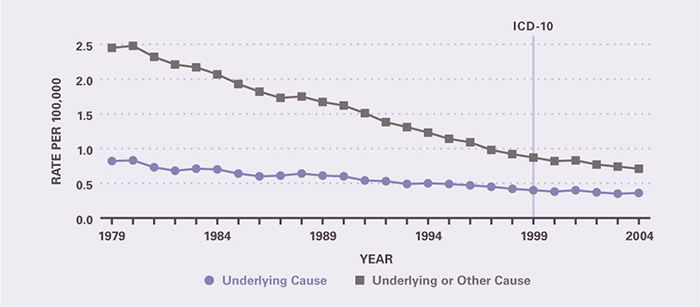
Case-fatality rates for gallstones were low in 2004, but there were still more than 1,000 deaths with gallstones listed as underlying cause (Table 2), because the condition is so common and complications can be severe. The large majority of deaths occurred among persons age 65 years and older. Thus, there were only about 4 Y YPLL prior to age 75 years per death with gallstones as the underlying cause. Age-adjusted death rates differed little by race and by sex. Mortality rates fell between 1979 and 2004 by 56 percent for gallstones as underlying cause and by 71 percent as underlying or other cause (Figure 2). This was the greatest rate of decline for any common digestive disease, continuing a pattern from at least 1950, when more than 5,000 persons had gallstones listed as underlying cause of death.24
According to the Verispan database of retail pharmacy prescriptions (Appendix 2), in 2004, the total number of prescriptions for gallstones was 1.65 million at a retail cost of $18.6 million. Analgesics constituted more than 99 percent of these prescriptions.
References
Table 1. Gallstones: Number and Age-Adjusted Rates of Ambulatory Care Visits and Hospital Discharges With First-Listed and All-Listed Diagnoses by Age, Race, and Sex in the United States, 2004
| Demographic Characteristics | Ambulatory Care Visits First-Listed Diagnosis Number in Thousands | Ambulatory Care Visits First-Listed Diagnosis Rate per 100,000 | Ambulatory Care Visits All-Listed Diagnosis Number in Thousands | Ambulatory Care Visits All-Listed Diagnosis Rate per 100,000 | Hospital Discharges First-Listed Diagnosis Number in Thousands | Hospital Discharges First-Listed Diagnosis Rate per 100,000 | Hospital Discharges All-Listed Diagnosis Number in Thousands | Hospital Discharges All-Listed Diagnosis Rate per 100,000 |
|---|---|---|---|---|---|---|---|---|
| AGE (Years) Under 15 |
— | — | — | — | 2 | 4 | 4 | 6 |
| AGE (Years) 15–44 |
443 | 352 | 651 | 518 | 119 | 95 | 179 | 142 |
| AGE (Years) 45–64 |
522 | 739 | 734 | 1,039 | 106 | 150 | 180 | 255 |
| AGE (Years) 65+ |
321 | 883 | 411 | 1,132 | 124 | 341 | 259 | 713 |
| Race White |
1,041 | 421 | 1,516 | 615 | 278 | 112 | 490 | 195 |
| Race Black |
127 | 369 | 179 | 521 | 34 | 102 | 63 | 198 |
| Sex Female |
932 | 604 | 1,358 | 882 | 235 | 151 | 406 | 256 |
| Sex Male |
367 | 260 | 478 | 336 | 114 | 85 | 214 | 162 |
| Total | 1,299 | 442 | 1,836 | 625 | 352 | 120 | 622 | 212 |
Figure 1. Gallstones: Age-Adjusted Rates of Ambulatory Care Visits and Hospital Discharges With All–Listed Diagnoses in the United States, 1979–2004
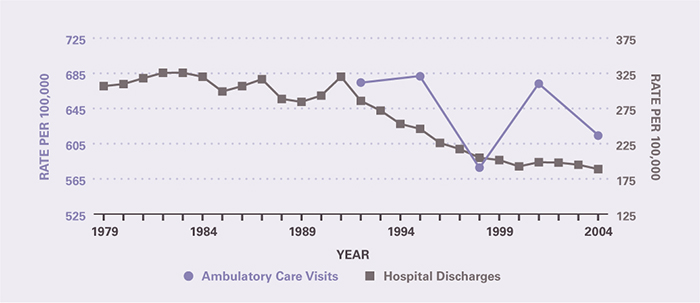
Table 2. Gallstones: Number and Age-Adjusted Rates of Deaths and Years of Potential Life Lost (to Age 75) by Age, Race, and Sex in the United States, 2004
| Demographic Characteristics | Underlying Cause Number of Deaths | Underlying Cause Rate per 100,000 | Underlying Cause Years of Potential Life Lost in Thousands | Underlying or Other Cause Number of Deaths | Underlying or Other Cause Rate per 100,000 |
|---|---|---|---|---|---|
| AGE (Years) Under 15 |
— | — | — | 1 | 0.0 |
| AGE (Years) 15–44 |
31 | 0.0 | 1.1 | 75 | 0.1 |
| AGE (Years) 45–64 |
137 | 0.2 | 2.6 | 276 | 0.4 |
| AGE (Years) 65+ |
924 | 2.5 | 0.6 | 1,803 | 5.0 |
| Race White |
960 | 0.4 | 3.3 | 1,883 | 0.7 |
| Race Black |
90 | 0.3 | 0.7 | 199 | 0.8 |
| Sex Female |
648 | 0.3 | 2.0 | 1,256 | 0.7 |
| Sex Male |
444 | 0.4 | 2.4 | 899 | 0.8 |
| Total | 1,092 | 0.4 | 4.4 | 2,155 | 0.7 |
Figure 2. Gallstones: Age-Adjusted Rates of Death in the United States, 1979–2004