

Chapter 15: Peptic Ulcer Disease
James E. Everhart, M.D., M.P.H.
Peptic ulcers are coded by anatomical location (stomach, duodenum, gastrojejunum, and unspecified), chronicity, and by complication (hemorrhage or perforation). The ICD codes that cover peptic ulcers are shown in Appendix 1. In 2004, there were about 700,000 ambulatory care visits with peptic ulcer as the first-listed diagnosis and an equal number in which it was a secondary diagnosis (Table 1). Ambulatory care rates increased with increasing age, were higher for blacks than for whites, and were higher among women. When listed at hospital discharge, peptic ulcer was the first-listed diagnosis 37 percent of the time.
The frequency of outpatient and inpatient care declined for peptic ulcer disease (Figure 1), which continued a pattern that began in the 1970s, if not before.8 Within 12 years, age-adjusted ambulatory care visit rates with a peptic ulcer diagnosis declined 68 percent, and within 25 years, hospital discharge rates declined 51 percent.
Peptic ulcer was coded as the underlying cause among 3,692 deaths in 2004 and other cause among an additional 4,604 deaths (Table 2). Nearly 80 percent of these deaths occurred among persons age 65 years and older. Age-adjusted death rates were similar for blacks and whites and were higher for males than females. Between 1979 and 2004, mortality from peptic ulcer as underlying cause declined 62.6 percent and as underlying or other cause by 68.8 percent (Figure 2). This continued at least a century of decline in peptic ulcer mortality.9 Much of the decline in the medical significance of peptic ulcer has been attributed to the decline of Helicobacter pylori, which is a causative agent. This effect has likely been accelerated by the widespread adoption of acid suppressive medications (Table 3) and eradication of H. pylori infection by antimicrobial agents. Although antimicrobial agents are important for treatment of peptic ulcer disease, they do not appear among the most commonly used drugs, perhaps because of their short-term self-limited use. The high use of acid suppressant therapy does not differentiate indications for treatment from prophylaxis.
References
Table 1. Peptic Ulcer Disease: Number and Age-Adjusted Rates of Ambulatory Care Visits and Hospital Discharges With First-Listed and All-Listed Diagnoses by Age, Race, and Sex in the United States, 2004
| Demographic Characteristics | Ambulatory Care Visits First-Listed Diagnosis Number in Thousands | Ambulatory Care Visits First-Listed Diagnosis Rate per 100,000 | Ambulatory Care Visits All-Listed Diagnosis Number in Thousands | Ambulatory Care Visits All-Listed Diagnosis Rate per 100,000 | Hospital Discharges First-Listed Diagnosis Number in Thousands | Hospital Discharges First-Listed Diagnosis Rate per 100,000 | Hospital Discharges All-Listed Diagnosis Number in Thousands | Hospital Discharges All-Listed Diagnosis Rate per 100,000 |
|---|---|---|---|---|---|---|---|---|
| AGE (Years) Under 15 |
— | — | — | — | 1 | 2 | 2 | 4 |
| AGE (Years) 15–44 |
251 | 199 | 472 | 375 | 23 | 19 | 61 | 48 |
| AGE (Years) 45–64 |
164 | 233 | 472 | 668 | 53 | 75 | 142 | 201 |
| AGE (Years) 65+ |
295 | 812 | 525 | 1,444 | 104 | 285 | 283 | 780 |
| Race White |
420 | 171 | 926 | 371 | 134 | 52 | 361 | 141 |
| Race Black |
71 | 251 | 149 | 491 | 21 | 70 | 65 | 218 |
| Sex Female |
389 | 242 | 898 | 574 | 92 | 55 | 259 | 154 |
| Sex Male |
323 | 230 | 575 | 408 | 89 | 68 | 229 | 176 |
| Total | 712 | 243 | 1,473 | 501 | 181 | 62 | 489 | 166 |
Figure 1. Peptic Ulcer Disease: Age-Adjusted Rates of Ambulatory Care Visits and Hospital Discharges With All–Listed Diagnoses in the United States, 1979–2004
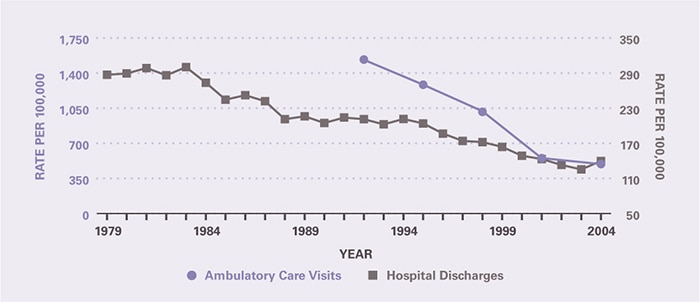
Table 2. Peptic Ulcer Disease: Number and Age-Adjusted Rates of Deaths and Years of Potential Life Lost (to Age 75) by Age, Race, and Sex in the United States, 2004
| Demographic Characteristics | Underlying Cause Number of Deaths | Underlying Cause Rate per 100,000 | Underlying Cause Years of Potential Life Lost in Thousands | Underlying or Other Cause Number of Deaths | Underlying or Other Cause Rate per 100,000 |
|---|---|---|---|---|---|
| AGE (Years) Under 15 |
7 | 0.0 | 0.5 | 9 | 0.0 |
| AGE (Years) 15–44 |
118 | 0.1 | 4.3 | 221 | 0.2 |
| AGE (Years) 45–64 |
646 | 0.9 | 12.1 | 1,331 | 1.9 |
| AGE (Years) 65+ |
2,921 | 8.0 | 2.7 | 6,733 | 18.5 |
| Race White |
3,221 | 1.2 | 14.9 | 7,183 | 2.7 |
| Race Black |
368 | 1.3 | 4.3 | 849 | 3.2 |
| Sex Female |
1,995 | 1.1 | 7.4 | 4,287 | 2.3 |
| Sex Male |
1,697 | 1.4 | 12.3 | 4,009 | 3.3 |
| Total | 3,692 | 1.3 | 19.7 | 8,296 | 2.8 |
Figure 2. Peptic Ulcer Disease: Age-Adjusted Rates of Death in the United States, 1979–2004
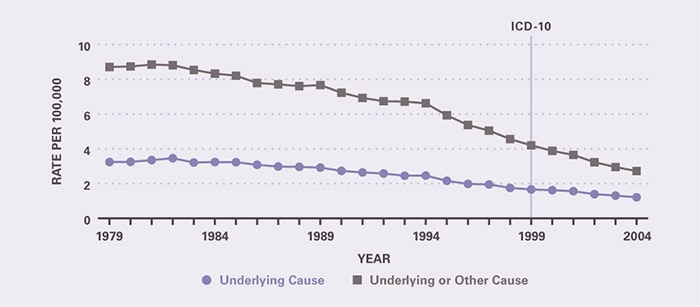
Table 3. Peptic Ulcer Disease: Costliest Prescriptions
| DRUG | Prescription (#) | Prescription | Retail Cost | Cost |
|---|---|---|---|---|
| Drug | Prescription (#) | Prescription | Retail Cost | Cost |
| Lansoprazole | 1,341,444 | 26.7% | $177,496,893 | 34.2% |
| Pantoprazole | 1,128,002 | 22.5 | 123,697,885 | 23.9 |
| Esomeprazole | 680,009 | 13.6 | 85,753,825 | 16.5 |
| Lansoprazole/Amoxicillin/Clarithromycin | 130,482 | 2.6 | 40,749,140 | 7.9 |
| Omeprazole | 333,879 | 6.7 | 30,663,736 | 5.9 |
| Rabeprazole | 204,602 | 4.1 | 27,175,479 | 5.2 |
| Ranitidine | 727,492 | 14.5 | 13,039,236 | 2.5 |
| Nizatidine | 89,340 | 1.8 | 9,185,345 | 1.8 |
| Sucralfate | 157,770 | 3.1 | 5,342,588 | 1.0 |
| Famotidine | 135,865 | 2.7 | 3,072,170 | 0.6 |
| Other | 89,023 | 1.8 | 2,394,483 | 0.4 |
| Total | 5,017,908 | 100.0% | $518,570,780 | 100.0% |
This content is provided as a service of the National Institute of Diabetes and Digestive and Kidney Diseases
(NIDDK), part of the National Institutes of Health. NIDDK translates and disseminates research findings to increase knowledge and understanding about health and disease among patients, health professionals, and the public. Content produced by NIDDK is carefully reviewed by NIDDK scientists and other experts.