

Chapter 2: Gastrointestinal Infections
James E. Everhart, M.D., M.P.H.
Most GI infections are self-limited and do not come to medical attention, although they are both extremely common and disruptive of daily activities, including school and work. GI infections are caused by viral and bacterial pathogens, but the minority that are most severe and for which causative agents are found are typically bacterial. The ICD-9 and ICD-10 codes match well, except for nonspecified organisms. The most significant differences are that Intestinal Infections Due to Other Organisms (008) and Ill-Defined Intestinal Infections (009) in ICD-9 were replaced by Other Bacterial Intestinal Infections (A04), Other Bacterial Foodborne Intoxications (A05), and Viral and Other Specified Intestinal Infections (A08) in ICD-10. Here is a breakdown of the codes for GI infections:
| ICD-9 | ICD-10 | |
|---|---|---|
| Cholera | 001 | A00 |
| Typhoid and Paratyphoid | 002 | A01 |
| Other Salmonella | 003 | A02 |
| Shigellosis | 004 | A03 |
| Other Food Poisoning | 005 | — |
| Other Bacterial Intestinal Infections | — | A04 |
| Other Bacterial Foodborne Intoxications | — | A05 |
| Amebiasis | 006 | A06 |
| Other Protozoal Intestinal Diseases | 007 | A07 |
| Intestinal Infections Due to Other Organisms | 008 | — |
| Viral and Other Specified Intestinal Infections | — | A08 |
| Ill-Defined Intestinal Infections | 009 |
— |
| Diarrhea and Gastroenteritis of Presumed Infectious Origin | — | A09 |
| All GI Infections | 001–009 | A00–A09 |
As shown in Table 1, in 2004, more than half of ambulatory care visits for GI infections occurred in those under the age of 15 years. When first-listed, the rate in this age group (1,930 per 100,000 population), was at least 4 times that of any other age group. Age-adjusted rates were 45.7 percent higher among whites than blacks and 18.1 percent higher among females than males. Relative to the frequency of ambulatory care visits, hospitalizations were uncommon. In contrast to those in ambulatory care, persons over age 65 years had both the highest number and rate of hospitalizations, and blacks had rates similar to those of whites. GI infections were considerably more often a secondary diagnosis (272,000) than first-listed diagnosis (178,000). The rate of age-adjusted hospitalizations with a diagnosis of GI infections increased by 92.8 percent between 1979 (76.1 per 100,000) and 2004 (146.7 per 100,000) and by 43.3 percent between 1992 (102.4 per 100,000) and 2004 (Figure 1).
In 2004, there were 4,396 deaths with a GI infection listed as the underlying cause (Table 2). The large majority of these deaths occurred among persons age 65 years and older. The death rate among whites was 50 percent higher than that among blacks, and the rates were similar among females and males. Similar patterns were seen for GI infections as either underlying or contributing cause. Because the majority of deaths occurred in the elderly, the YPLL prior to age 75 years was small, less than 3 years per death. In recent years, there has been a remarkable increase in deaths from GI infections (Figure 2). Over the 20-year period between 1979 and 1999, the age-adjusted underlying cause mortality rate doubled from 0.21 per 100,000 to 0.42 per 100,000. But in the 5 years from 1999 to 2004, the rate more than tripled to 1.44 per 100,000. About two-thirds of the more recent increase is due to one bacterial cause, Clostridium difficile, which is coded under Other Bacterial Intestinal Infections as A04.7.
MEDICATIONS
The costliest prescriptions filled at retail pharmacies for GI infections in 2004, according to the Verispan database (Appendix 2), are shown in Table 3. Most were antimicrobial agents, such as ciprofloxacin, or they affected GI motility, such as promethazine. An estimated 938,000 outpatient prescriptions were filled.
Table 1. Gastrointestinal Infections: Number and Age-Adjusted Rates of Ambulatory Care Visits and Hospital Discharges With First-Listed and All-Listed Diagnoses by Age, Race, and Sex in the United States, 2004
| Demographic Characteristics | Ambulatory Care Visits First-Listed Diagnosis Number in Thousands | Ambulatory Care Visits First-Listed Diagnosis Rate per 100,000 | Ambulatory Care Visits All-Listed Diagnosis Number in Thousands | Ambulatory Care Visits All-Listed Diagnosis Rate per 100,000 | Hospital Discharges First-Listed Diagnosis Number in Thousands | Hospital Discharges First-Listed Diagnosis Rate per 100,000 | Hospital Discharges All-Listed Diagnosis Number in Thousands | Hospital Discharges All-Listed Diagnosis Rate per 100,000 |
|---|---|---|---|---|---|---|---|---|
| AGE (Years) Under 15 |
1,174 | 1,930 | 1,222 | 2,010 | 47 | 77 | 83 | 137 |
| AGE (Years) 15–44 |
579 | 460 | 672 | 534 | 31 | 25 | 65 | 51 |
| AGE (Years) 45–64 |
266 | 377 | 311 | 440 | 34 | 47 | 86 | 122 |
| AGE (Years) 65+ |
109 | 301 | 159 | 439 | 66 | 183 | 215 | 593 |
| Race White |
1,800 | 785 | 1,994 | 867 | 140 | 57 | 359 | 144 |
| Race Black |
225 | 529 | 253 | 595 | 16 | 46 | 48 | 151 |
| Sex Female |
1,142 | 796 | 1,279 | 888 | 107 | 67 | 261 | 160 |
| Sex Male |
986 | 684 | 1,085 | 752 | 71 | 52 | 188 | 142 |
| Total | 2,128 | 725 | 2,365 | 805 | 178 | 61 | 450 | 153 |
Figure 1. Gastrointestinal Infections: Age-Adjusted Rates of Ambulatory Care Visits and Hospital Discharges With All–Listed Diagnoses in the United States, 1979–2004
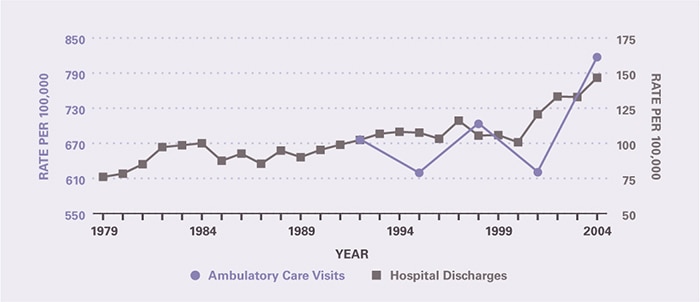
Table 2. Gastrointestinal Infections: Number and Age-Adjusted Rates of Deaths and Years of Potential Life Lost (to Age 75) by Age, Race, and Sex in the United States, 2004
| Demographic Characteristics | Underlying Cause Number of Deaths | Underlying Cause Rate per 100,000 | Underlying Cause Years of Potential Life Lost in Thousands | Underlying or Other Cause Number of Deaths | Underlying or Other Cause Rate per 100,000 |
|---|---|---|---|---|---|
| AGE (Years) Under 15 |
32 | 0.1 | 2.3 | 40 | 0.1 |
| AGE (Years) 15–44 |
49 | 0.0 | 1.9 | 97 | 0.1 |
| AGE (Years) 45–64 |
353 | 0.5 | 6.0 | 577 | 0.8 |
| AGE (Years) 65+ |
3,962 | 10.9 | 2.6 | 6,345 | 17.5 |
| Race White |
4,104 | 1.5 | 10.7 | 6,552 | 2.5 |
| Race Black |
241 | 1.0 | 1.6 | 422 | 1.6 |
| Sex Female |
2,746 | 1.5 | 6.4 | 4,257 | 2.3 |
| Sex Male |
1,650 | 1.4 | 6.4 | 2,802 | 2.4 |
| Total | 4,396 | 1.5 | 12.8 | 7,059 | 2.4 |
Figure 2. Gastrointestinal Infections: Age-Adjusted Rates of Death in the United States, 1979–2004
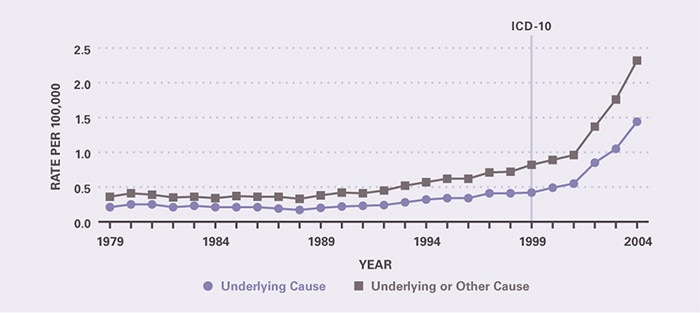
Table 3. Gastrointestinal Infections: Costliest Prescriptions
| DRUG | Prescription (#) | Prescription | Retail Cost | Cost |
|---|---|---|---|---|
| Vancomycin | 14,507 | 1.5% | $28,375,011 | 62.9% |
| Promethazine | 346,794 | 37.0 | 5,985,173 | 13.3 |
| Ciprofloxacin | 126,523 | 13.4 | 5,132,893 | 11.4 |
| Metronidazole | 184,090 | 19.6 | 2,986,288 | 6.6 |
| Loperamide | 112,285 | 12.0 | 865,924 | 1.9 |
| Diphenoxylate | 122,042 | 13.0 | 832,096 | 1.8 |
| Levofloxacin | 7,325 | 0.8 | 483,046 | 1.1 |
| Acidophilus/Bulgaricus | 20,432 | 2.2 | 275,062 | 0.6 |
| Ciprofloxacin-Betaine Combination | 1,215 | 0.1 | 109,988 | 0.2 |
| Prochlorperazine | 2,927 | 0.3 | 26,326 | 0.1 |
| Other | 67 | 0.0 | 5,788 | 0.0 |
| Total | 938,207 | 100.0% | $45,077,595 | 100.0% |