

Chapter 8: Cancer of the Colon & Rectum
James E. Everhart, M.D., M.P.H.
For this report, cancers of the colon and rectum were combined (see Appendix 1 for ICD codes). Together, these cancers were responsible for an estimated 55 percent of all digestive system cancers diagnosed in 2004. In 72.5 percent of cases, the colon was the anatomical site. By themselves, colon cancer would be the most common digestive system cancer, and rectal cancer the second most common. Therefore, trends in colorectal cancer largely determine trends in digestive system cancers as a whole.
Two-thirds of new cases of colorectal cancer were among those age 65 years or older (Table 1). Among the major racial-ethnic groups, non-Hispanic blacks had the highest rate, followed by non-Hispanic whites. American Indians had the lowest rates, with Hispanics and Asians intermediate. Age-adjusted rates were about one-third higher among males than females. Colorectal cancer incidence has been falling for the past 20 years, declining by 27.1 percent from 1985 to 2004 (Figure 1). The proportion of newly diagnosed patients who survived for at least 5 years has climbed steadily since 1979.
Colorectal cancer is the digestive system malignancy with the most reliable data on medical care (Table 2). In 2004, there were an estimated 2.6 million ambulatory care visits for persons with colorectal cancer. Most visits were among persons age 65 years and older and among women. Blacks had two-thirds the age-adjusted rate of whites. Visit rates were similar for males and females. For hospitalizations, colorectal cancer was more often listed as a first-listed diagnosis than as a secondary diagnosis. Hospitalization rates were disproportionately higher among the 65 years and older group. Age-adjusted rates were higher for blacks than for whites and for males than for females. Hospitalization rates declined from the early 1980s through 1995, and subsequently increased slightly (Figure 2).
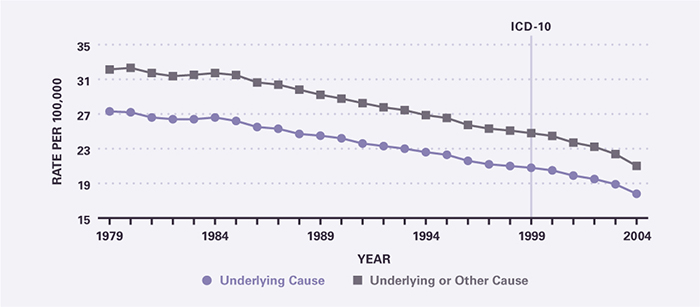
Colorectal cancer was the leading cause of death related to the digestive system, accounting for 22.5 percent of deaths (Table 3). Because the median age of death for colorectal cancer was 75 years (PDF, 28 KB) , colorectal cancer accounted for a smaller proportion of YPLL to digestive diseases (16.6 percent), second to liver disease. Because of declining incidence and improved survival, death rates declined 34.8 percent between 1979 and 2004. This decline accelerated during the latter part of that period (Figure 3).
Table 1. Colorectal Cancer: Number of Cases and Incidence Rates by Age, Race/Ethnicity, and Sex, 2004
| Demographic Characteristics | Number of Cases | Incidence per 100,000 Unadjusted | Incidence per 100,000 Age-Adjusted |
|---|---|---|---|
| AGE (Years) Under 15 |
— | — | — |
| AGE (Years) 15–44 |
6,019 | 5.0 | — |
| AGE (Years) 45–64 |
41,467 | 59.2 | — |
| AGE (Years) 65+ |
87,872 | 256.9 | — |
| RACE/ETHNICITY Non-Hispanic White |
111,509 | 58.0 | 48.5 |
| RACE/ETHNICITY Non-Hispanic Black |
14,251 | 41.7 | 58.6 |
| RACE/ETHNICITY Hispanic |
7,370 | 18.2 | 38.1 |
| RACE/ETHNICITY Asian/Pacific Islander |
4,089 | 33.2 | 38.6 |
| RACE/ETHNICITY American Indian/Alaska Native |
477 | 25.8 | 35.8 |
| Sex Female |
64,080 | 43.9 | 41.1 |
| Sex Male |
65,069 | 46.5 | 55.7 |
| Total | 129,189 | 45.2 | 47.5 |
Figure 1. Colorectal Cancer: Age-Adjusted Incidence Rates and 5-Year Survival Rates, 1979–2004
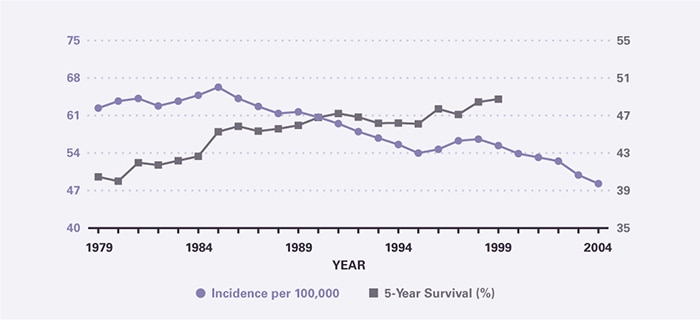
Table 2. Colorectal Cancer: Number and Age-Adjusted Rates of Ambulatory Care Visits and Hospital Discharges With First-Listed and All-Listed Diagnoses by Age, Race, and Sex in the United States, 2004
| Demographic Characteristics | Ambulatory Care Visits First-Listed Diagnosis Number in Thousands | Ambulatory Care Visits First-Listed Diagnosis Rate per 100,000 | Ambulatory Care Visits All-Listed Diagnosis Number in Thousands | Ambulatory Care Visits All-Listed Diagnosis Rate per 100,000 | Hospital Discharges First-Listed Diagnosis Number in Thousands | Hospital Discharges First-Listed Diagnosis Rate per 100,000 | Hospital Discharges All-Listed Diagnosis Number in Thousands | Hospital Discharges All-Listed Diagnosis Rate per 100,000 |
|---|---|---|---|---|---|---|---|---|
| AGE (Years) Under 15 |
— | — | — | — | — | — | — | — |
| AGE (Years) 15–44 |
56 | 45 | 83 | 66 | 7 | 6 | 14 | 11 |
| AGE (Years) 45–64 |
721 | 1,021 | 875 | 1,238 | 47 | 66 | 80 | 113 |
| AGE (Years) 65+ |
1,321 | 3,636 | 1,627 | 4,477 | 97 | 268 | 160 | 441 |
| Race White |
1,892 | 747 | 2,323 | 915 | 118 | 45 | 195 | 76 |
| Race Black |
127 | 426 | 177 | 601 | 17 | 59 | 30 | 107 |
| Sex Female |
1,134 | 705 | 1,456 | 902 | 76 | 45 | 127 | 75 |
| Sex Male |
969 | 736 | 1,133 | 856 | 76 | 58 | 127 | 98 |
| Total | 2,103 | 716 | 2,589 | 882 | 151 | 52 | 255 | 87 |
Figure 2. Colorectal Cancer: Age-Adjusted Rates of Ambulatory Care Visits and Hospital Discharges With All–Listed Diagnoses in the United States, 1979–2004
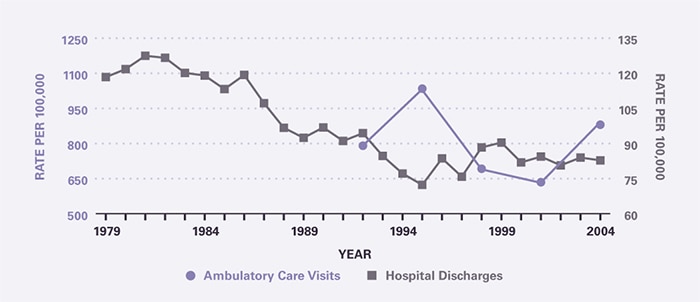
Table 3. Colorectal Cancer: Number and Age-Adjusted Rates of Deaths and Years of Potential Life Lost (to Age 75) by Age, Race, and Sex in the United States, 2004
| Demographic Characteristics | Underlying Cause Number of Deaths | Underlying Cause Rate per 100,000 | Underlying Cause Years of Potential Life Lost in Thousands | Underlying or Other Cause Number of Deaths | Underlying or Other Cause Rate per 100,000 |
|---|---|---|---|---|---|
| AGE (Years) Under 15 |
1 | 0.0 | 0.1 | 2 | 0.0 |
| AGE (Years) 15–44 |
1,608 | 1.3 | 58.3 | 1,654 | 1.3 |
| AGE (Years) 45–64 |
12,262 | 17.3 | 219.9 | 13,056 | 18.5 |
| AGE (Years) 65+ |
39,355 | 108.3 | 54.9 | 48,188 | 132.6 |
| Race White |
45,340 | 17.3 | 263.0 | 53,979 | 20.6 |
| Race Black |
6,592 | 24.7 | 57.7 | 7,446 | 28.2 |
| Sex Female |
26,512 | 15.1 | 142.8 | 31,153 | 17.5 |
| Sex Male |
26,714 | 21.5 | 190.2 | 31,747 | 25.9 |
| Total | 53,226 | 18.1 | 333.0 | 62,900 | 21.4 |
Figure 3. Colorectal Cancer: Age-Adjusted Rates of Death in the United States, 1979–2004
This content is provided as a service of the National Institute of Diabetes and Digestive and Kidney Diseases
(NIDDK), part of the National Institutes of Health. NIDDK translates and disseminates research findings to increase knowledge and understanding about health and disease among patients, health professionals, and the public. Content produced by NIDDK is carefully reviewed by NIDDK scientists and other experts.