

Chapter 14: Gastroesphageal Reflux Disease
James E. Everhart, M.D., M.P.H.
In 2004, GERD was by far the most frequently first-listed digestive system condition at ambulatory care visits (Table 1), constituting 17.5 percent of all digestive system diagnoses. There were at least 6 outpatient visits with a GERD diagnosis listed per 100 persons in the United States. GERD was a common diagnosis in all age groups, although the highest rate was for those age 65 years and older. Age-adjusted ambulatory care visit rates were higher among blacks than whites and were similar for females and males. As the first-listed diagnosis, hospitalizations with GERD were not especially common relative to the frequency of outpatient visits. However, GERD was the first-listed diagnosis on only 5 percent of hospital discharges on which it was mentioned. As a result, GERD was the most common digestive system disease noted at hospital discharge and was found on 23.5 percent of hospitalizations at which a digestive system condition was listed at discharge. The pattern by race and sex of rates of hospitalization with a diagnosis of GERD were similar to the rates of ambulatory care visits. About half of all hospital diagnoses were recorded at age 65 years and older.
Rates of both all-listed ambulatory care visits and hospital discharges increased several-fold from the early 1990s to 2004 (Figure 1). Among other digestive system diseases, only viral hepatitis C saw a similar increase in medical care, but much of that increase was a result of the fact that hepatitis C was not recognized as a disease with its own ICD code until 1992. The increases in medical care for GERD began at least as early as the mid-1970s.7 Between 1975 and 2004, the rate of all-listed ambulatory care visits for GERD increased approximately 2,000 percent. It was in the mid-1970s that better means to diagnose (flexible endoscopes) and treat (histamine-2 receptor blockers) became available, both of which stimulated recognition of the condition. Nevertheless, it is quite unlikely that all the increases in GERD-related statistics can be attributed solely to increased recognition.
Despite not being considered a fatal disease, GERD was listed as the underlying cause of more than 1,000 deaths in 2004 (Table 2), 83 percent of which occurred among persons age 65 years and older. GERD was much more often listed as a contributing cause of death, with the large majority at age 65 years and older. Mortality rates differed little by race and sex. Rates of GERD as a first-listed or contributing cause of death increased by 115 percent from 1979 to 2004, with the majority of the increase occurring during the last 9 years of that period (Figure 2).
More than 60 million prescriptions for GERD were estimated to have been filled at retail pharmacies in 2004 (Table 3), representing 48 percent of all prescriptions for digestive system disorders and more than 50 percent of their cost. The large majority of prescriptions and their cost were for proton pump inhibitors, which were the five most commonly prescribed and costliest medications. Because over-the-counter medications were not included in this tabulation, the total medication cost may have been considerably higher.
References
Table 1. Gastroesophageal Reflux Disease: Number and Age-Adjusted Rates of Ambulatory Care Visits and Hospital Discharges With First-Listed and All-Listed Diagnoses by Age, Race, and Sex in the United States, 2004
| Demographic Characteristics | Ambulatory Care Visits First-Listed Diagnosis Number in Thousands | Ambulatory Care Visits First-Listed Diagnosis Rate per 100,000 | Ambulatory Care Visits All-Listed Diagnosis Number in Thousands | Ambulatory Care Visits All-Listed Diagnosis Rate per 100,000 | Hospital Discharges First-Listed Diagnosis Number in Thousands | Hospital Discharges First-Listed Diagnosis Rate per 100,000 | Hospital Discharges All-Listed Diagnosis Number in Thousands | Hospital Discharges All-Listed Diagnosis Rate per 100,000 |
|---|---|---|---|---|---|---|---|---|
| AGE (Years) Under 15 |
693 | 1,139 | 1,504 | 2,473 | 20 | 33 | 110 | 182 |
| AGE (Years) 15–44 |
2,083 | 1,656 | 4,064 | 3,230 | 28 | 22 | 463 | 368 |
| AGE (Years) 45–64 |
2,463 | 3,484 | 6,961 | 9,847 | 53 | 75 | 1,050 | 1,486 |
| AGE (Years) 65+ |
1,611 | 4,433 | 5,813 | 15,999 | 58 | 159 | 1,565 | 4,307 |
| Race White |
5,567 | 2,267 | 14,964 | 6,002 | 122 | 49 | 2,513 | 987 |
| Race Black |
1,028 | 2,872 | 2,603 | 8,075 | 21 | 65 | 342 | 1,107 |
| Sex Female |
3,388 | 2,209 | 10,624 | 6,733 | 87 | 54 | 1,936 | 1,183 |
| Sex Male |
3,462 | 2,462 | 7,718 | 5,506 | 71 | 51 | 1,252 | 937 |
| Total | 6,849 | 2,332 | 18,342 | 6,246 | 158 | 54 | 3,189 | 1,086 |
Figure 1. Gastroesophageal Reflux Disease: Age-Adjusted Rates of Ambulatory Care Visits and Hospital Discharges With All–Listed Diagnoses in the United States, 1979–2004
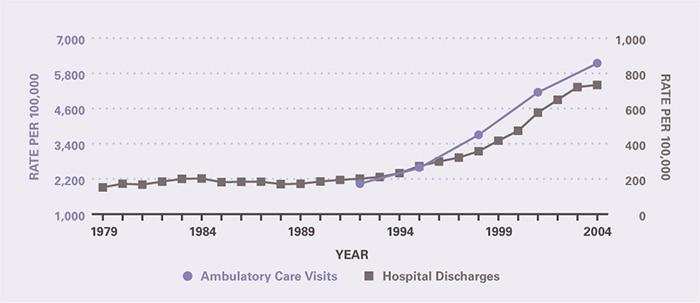
Table 2. Gastroesophageal Reflux Disease: Number and Age-Adjusted Rates of Deaths and Years of Potential Life Lost (to Age 75) by Age, Race, and Sex in the United States, 2004
| Demographic Characteristics | Underlying Cause Number of Deaths | Underlying Cause Rate per 100,000 | Underlying Cause Years of Potential Life Lost in Thousands | Underlying or Other Cause Number of Deaths | Underlying or Other Cause Rate per 100,000 |
|---|---|---|---|---|---|
| AGE (Years) Under 15 |
18 | 0.0 | 1.3 | 106 | 0.2 |
| AGE (Years) 15–44 |
43 | 0.0 | 1.6 | 228 | 0.2 |
| AGE (Years) 45–64 |
135 | 0.2 | 2.5 | 1,034 | 1.5 |
| AGE (Years) 65+ |
954 | 2.6 | 0.6 | 6,669 | 18.4 |
| Race White |
1,033 | 0.4 | 4.7 | 7,273 | 2.7 |
| Race Black |
97 | 0.4 | 1.1 | 649 | 2.5 |
| Sex Female |
653 | 0.3 | 2.2 | 4,470 | 2.4 |
| Sex Male |
497 | 0.4 | 3.8 | 3,567 | 3.0 |
| Total | 1,150 | 0.4 | 6.0 | 8,037 | 2.7 |
Figure 2. Gastroesophageal Reflux Disease: Age-Adjusted Rates of Death in the United States, 1979–2004
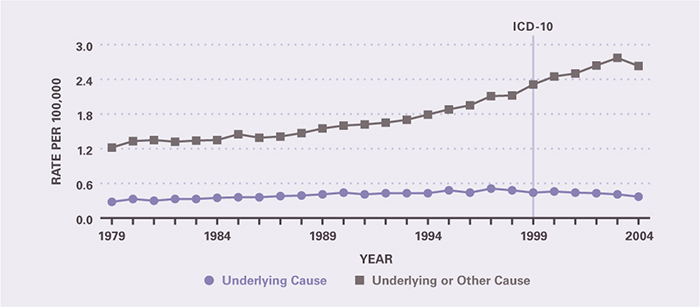
Table 3. Gastroesophageal Reflux Disease: Costliest Prescriptions
| DRUG | Prescription (#) | Prescription | Retail Cost | Cost |
|---|---|---|---|---|
| Lansoprazole | 14,233,183 | 22.0% | $2,187,235,735 | 28.4% |
| Esomeprazole | 14,250,281 | 22.1 | 2,180,756,920 | 28.4 |
| Pantoprazole | 9,995,074 | 15.5 | 1,224,174,329 | 15.9 |
| Rabeprazole | 5,954,447 | 9.2 | 914,472,545 | 11.9 |
| Omeprazole | 6,630,268 | 10.3 | 840,514,740 | 10.9 |
| Ranitidine | 8,771,688 | 13.6 | 202,788,663 | 2.6 |
| Famotidine | 1,527,991 | 2.4 | 51,413,838 | 0.7 |
| Metoclopramide | 2,326,992 | 3.6 | 34,416,702 | 0.4 |
| Nizatidine | 187,276 | 0.3 | 26,124,573 | 0.3 |
| Sucralfate | 112,698 | 0.2 | 11,892,069 | 0.2 |
| Other | 622,786 | 0.8 | 15,976,940 | 0.2 |
| Total | 64,612,684 | 100.0% | $7,689,767,054 | 100.0% |
This content is provided as a service of the National Institute of Diabetes and Digestive and Kidney Diseases
(NIDDK), part of the National Institutes of Health. NIDDK translates and disseminates research findings to increase knowledge and understanding about health and disease among patients, health professionals, and the public. Content produced by NIDDK is carefully reviewed by NIDDK scientists and other experts.