

Chapter 10: Cancer of the Bile Ducts
James E. Everhart, M.D., M.P.H.
For this report, intrahepatic and extrahepatic bile duct cancers were combined (see Appendix 1 for ICD-9 and ICD-10 codes). Substantial differences between them are noted.
In 2004, 22 percent of bile duct cancer was coded intrahepatic and 45 percent extrahepatic; nearly all the remainder did not have a location specified. Rates were much higher in the oldest age group, with 74 percent of cases occurring at age 65 or older. Age-adjusted rates were highest among Hispanics and Asians (Table 1). Males had a higher rate and slightly higher number of cases than females. Incidence increased modestly between 1979 and 2004 (about 22 percent), all of which could be accounted for by an increase in the incidence of intrahepatic bile duct cancer. Five-year survival did not improve and was about 10 percent for the entire period (Figure 1). There were too few outpatient or inpatient diagnoses to draw inferences about medical care (Table 2), but hospitalization rates were relatively constant at about 5 per 100,000 U.S. population (Figure 2).
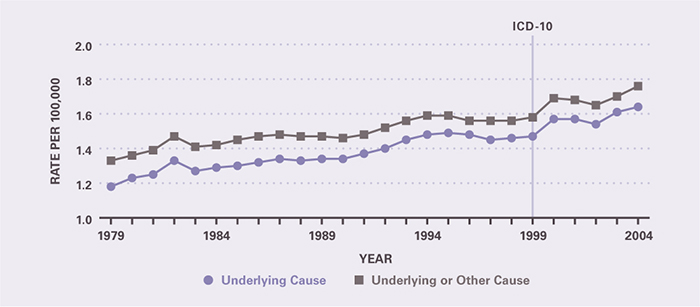
Because of low survival, bile duct cancer mortality was similar to incidence. As underlying cause, there were 4,954 deaths in 2004 and nearly 33,000 YPLL prior to age 75 years (Table 3). Rates were highest in the oldest age group. Age-adjusted mortality rates were slightly higher for whites and for males. Death rates for bile duct cancer rose 39 percent between 1979 and 2004 (Figure 3).
Table 1. Bile Duct Cancer: Number of Cases and Incidence Rate by Age, Race/Ethnicity, and Sex, 2004
| Demographic Characteristics | Number of Cases | Incidence per 100,000 Unadjusted | Incidence per 100,000 Age-Adjusted |
|---|---|---|---|
| AGE (Years) Under 15 |
— | — | — |
| AGE (Years) 15–44 |
266 | 0.2 | — |
| AGE (Years) 45–64 |
1,655 | 2.4 | — |
| AGE (Years) 65+ |
4,569 | 13.4 | — |
| RACE/ETHNICITY Non-Hispanic White |
4,859 | 2.5 | 2.1 |
| RACE/ETHNICITY Non-Hispanic Black |
523 | 1.5 | 2.1 |
| RACE/ETHNICITY Hispanic |
519 | 1.3 | 2.8 |
| RACE/ETHNICITY Asian/Pacific Islander |
332 | 2.7 | 3.3 |
| RACE/ETHNICITY American Indian/Alaska Native |
— | — | — |
| Sex Female |
3,051 | 2.1 | 2.0 |
| Sex Male |
3,133 | 2.2 | 2.7 |
| Total | 6,186 | 2.2 | — |
Figure 1. Bile Duct Cancer: Age-Adjusted Incidence Rates and 5-Year Survival Rates, 1979–2004
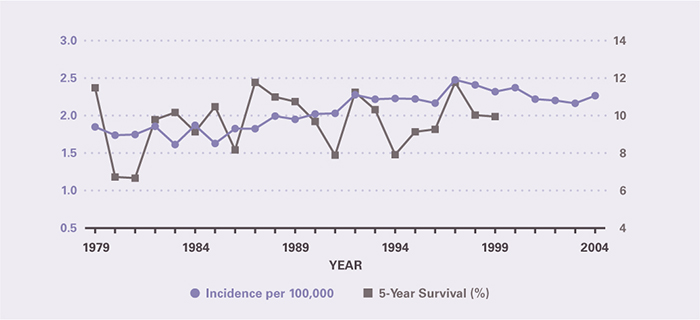
Table 2. Bile Duct Cancer: Number and Age-Adjusted Rates of Ambulatory Care Visits and Hospital Discharges With First-Listed and All-Listed Diagnoses by Age, Race, and Sex in the United States, 2004
| Demographic Characteristics | Ambulatory Care Visits First-Listed Diagnosis Number in Thousands | Ambulatory Care Visits First-Listed Diagnosis Rate per 100,000 | Ambulatory Care Visits All-Listed Diagnosis Number in Thousands | Ambulatory Care Visits All-Listed Diagnosis Rate per 100,000 | Hospital Discharges First-Listed Diagnosis Number in Thousands | Hospital Discharges First-Listed Diagnosis Rate per 100,000 | Hospital Discharges All-Listed Diagnosis Number in Thousands | Hospital Discharges All-Listed Diagnosis Rate per 100,000 |
|---|---|---|---|---|---|---|---|---|
| AGE (Years) Under 15 |
— | — | — | — | — | — | — | — |
| AGE (Years) 15–44 |
— | — | — | — | 0 | 0 | 1 | 1 |
| AGE (Years) 45–64 |
— | — | — | — | 2 | 3 | 5 | 7 |
| AGE (Years) 65+ |
— | — | — | — | 6 | 17 | 11 | 30 |
| Race White |
— | — | — | — | 7 | 3 | 14 | 5 |
| Race Black |
— | — | — | — | 1 | 3 | 1 | 5 |
| Sex Female |
— | — | — | — | 4 | 3 | 8 | 5 |
| Sex Male |
— | — | — | — | 5 | 4 | 9 | 7 |
| Total | — | — | — | — | 9 | 3 | 17 | 6 |
Figure 2. Bile Duct Cancer: Age-Adjusted Rates of Ambulatory Care Visits and Hospital Discharges With All–Listed Diagnoses in the United States, 1979–2004 (Ambulatory Care Visit Data Unavailable)
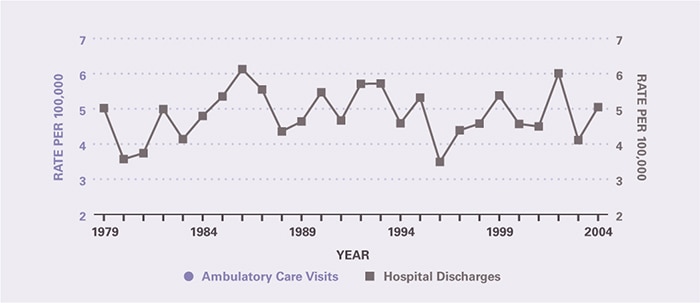
Table 3. Bile Duct Cancer: Number and Age-Adjusted Rates of Deaths and Years of Potential Life Lost (to Age 75) by Age, Race, and Sex in the United States, 2004
| Demographic Characteristics | Underlying Cause Number of Deaths | Underlying Cause Rate per 100,000 | Underlying Cause Years of Potential Life Lost in Thousands | Underlying or Other Cause Number of Deaths | Underlying or Other Cause Rate per 100,000 |
|---|---|---|---|---|---|
| AGE (Years) Under 15 |
2 | 0.0 | 0.1 | 3 | 0.0 |
| AGE (Years) 15–44 |
143 | 0.1 | 5.2 | 148 | 0.1 |
| AGE (Years) 45–64 |
1,245 | 1.8 | 21.9 | 1,308 | 1.9 |
| AGE (Years) 65+ |
3,564 | 9.8 | 5.7 | 3,855 | 10.6 |
| Race White |
4,348 | 1.7 | 27.6 | 4,657 | 1.8 |
| Race Black |
366 | 1.4 | 3.4 | 401 | 1.5 |
| Sex Female |
2,554 | 1.5 | 15.1 | 2,711 | 1.6 |
| Sex Male |
2,400 | 1.9 | 17.8 | 2,603 | 2.1 |
| Total | 4,954 | 1.7 | 32.9 | 5,314 | 1.8 |
Figure 3. Bile Duct Cancer: Age-Adjusted Rates of Death in the United States, 1979–2004
This content is provided as a service of the National Institute of Diabetes and Digestive and Kidney Diseases
(NIDDK), part of the National Institutes of Health. NIDDK translates and disseminates research findings to increase knowledge and understanding about health and disease among patients, health professionals, and the public. Content produced by NIDDK is carefully reviewed by NIDDK scientists and other experts.