

Chapter 7: Cancer of the Small Intestine
James E. Everhart, M.D., M.P.H.
Cancer of the small intestine is often considered rare, but in 2004, there were more than 5,000 new cases diagnosed (exclusive of intestinal lymphomas), or about a third the total number of esophageal cancers or primary liver cancers, and more than the number of gallbladder cancers. Slightly more than half of patients were diagnosed at age 65 years or older (Table 1), with a median age of 67 years (PDF, 28 KB) , making this the digestive system cancer with the second youngest age of onset (after primary liver cancer). Nevertheless, rates were highest among the elderly and among blacks and males.
Age-adjusted incidence for cancer of the small intestine increased by 73 percent between 1979 and 2004 (Figure 1). Lack of awareness of the magnitude of this increase may be a reason for the perception that it remains a rare cancer. Over the same period, 5-year survival improved modestly, from about 33 percent to about 41 percent. National medical care systems do not adequately capture outpatient or inpatient visits (Table 2), although rates of hospital discharges have tended to increase in recent years (Figure 2). The number of hospitalizations prior to 1988 was too small to provide estimates.
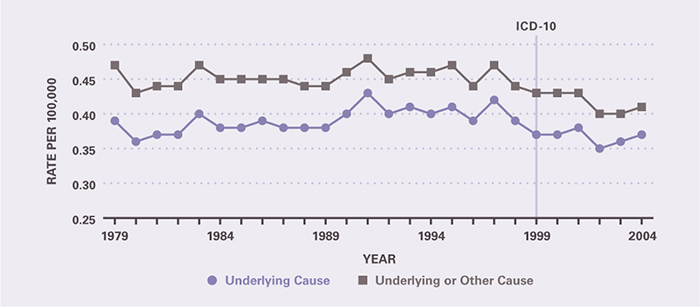
Because of its relatively high survival rate, there were only 1,115 deaths from cancer of the small intestine in 2004, and fewer than 10,000 YPLL prior to age 75 years (Table 3). The majority of deaths occurred among persons age 65 years and older. Death rates were higher for blacks than whites and for males than females, reflecting the incidence rates. Age-adjusted death rates changed little between 1979 and 2004 (Figure 3).
Table 1. Cancer of the Small Intestine: Number of Cases and Incidence Rates by Age, Race/Ethnicity, and Sex, 2004
| Demographic Characteristics | Number of Cases | Incidence per 100,000 Unadjusted | Incidence per 100,000 Age-Adjusted |
|---|---|---|---|
| AGE (Years) Under 15 |
— | — | — |
| AGE (Years) 15–44 |
407 | 0.3 | — |
| AGE (Years) 45–64 |
1,987 | 2.8 | — |
| AGE (Years) 65+ |
2,889 | 8.4 | — |
| RACE/ETHNICITY Non-Hispanic White |
4,298 | 2.2 | 1.9 |
| RACE/ETHNICITY Non-Hispanic Black |
756 | 2.2 | 3.0 |
| RACE/ETHNICITY Hispanic |
295 | 0.7 | 1.4 |
| RACE/ETHNICITY Asian/Pacific Islander |
107 | 0.9 | 1.0 |
| RACE/ETHNICITY American Indian/Alaska Native |
— | — | — |
| Sex Female |
2,357 | 1.6 | 1.5 |
| Sex Male |
2,703 | 1.9 | 2.2 |
| Total | 5,065 | 1.8 | — |
Figure 1. Cancer of the Small Intestine: Age-Adjusted Incidence Rates and 5-Year Survival Rates, 1979–2004
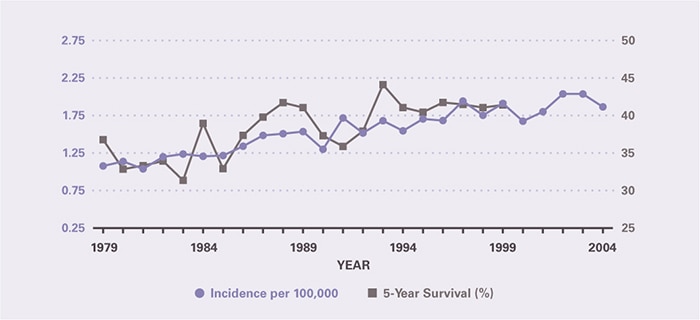
Table 2. Cancer of the Small Intestine: Number and Age-Adjusted Rates of Ambulatory Care Visits and Hospital Discharges With First-Listed and All-Listed Diagnoses by Age, Race, and Sex in the United States, 2004
| Demographic Characteristics | Ambulatory Care Visits First-Listed Diagnosis Number in Thousands | Ambulatory Care Visits First-Listed Diagnosis Rate per 100,000 | Ambulatory Care Visits All-Listed Diagnosis Number in Thousands | Ambulatory Care Visits All-Listed Diagnosis Rate per 100,000 | Hospital Discharges First-Listed Diagnosis Number in Thousands | Hospital Discharges First-Listed Diagnosis Rate per 100,000 | Hospital Discharges All-Listed Diagnosis Number in Thousands | Hospital Discharges All-Listed Diagnosis Rate per 100,000 |
|---|---|---|---|---|---|---|---|---|
| AGE (Years) Under 15 |
— | — | — | — | — | — | — | — |
| AGE (Years) 15–44 |
— | — | — | — | 0 | 0 | 1 | 1 |
| AGE (Years) 45–64 |
— | — | — | — | 2 | 3 | 3 | 5 |
| AGE (Years) 65+ |
— | — | — | — | 3 | 9 | 5 | 14 |
| Race White |
— | — | — | — | 5 | 2 | 7 | 3 |
| Race Black |
— | — | — | — | 1 | 3 | 1 | 5 |
| Sex Female |
— | — | — | — | 3 | 2 | 4 | 3 |
| Sex Male |
— | — | — | — | 3 | 2 | 5 | 4 |
| Total | — | — | — | — | 6 | 2 | 9 | 3 |
Figure 2. Cancer of the Small Intestine: Age-Adjusted Rates of Ambulatory Care Visits and Hospital Discharges With Any‑L‑Listed Diagnoses in the United States, 1979–2004 (Ambulatory Care Visit Data Unavailable)
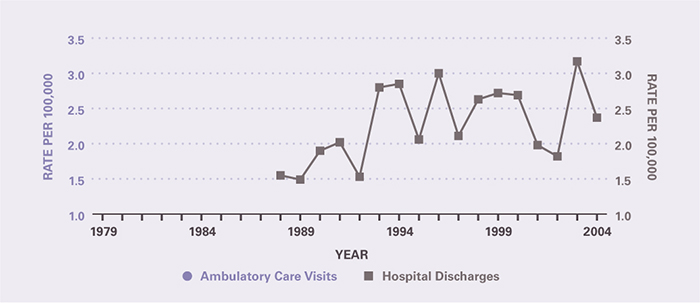
Table 3. Cancer of the Small Intestine: Number and Age-Adjusted Rates of Deaths and Years of Potential Life Lost (to Age 75) by Age, Race, and Sex in the United States, 2004
| Demographic Characteristics | Underlying Cause Number of Deaths | Underlying Cause Rate per 100,000 | Underlying Cause Years of Potential Life Lost in Thousands | Underlying or Other Cause Number of Deaths | Underlying or Other Cause Rate per 100,000 |
|---|---|---|---|---|---|
| AGE (Years) Under 15 |
— | — | — | — | — |
| AGE (Years) 15–44 |
55 | 0.0 | 2.0 | 59 | 0.0 |
| AGE (Years) 45–64 |
329 | 0.5 | 6.0 | 358 | 0.5 |
| AGE (Years) 65+ |
731 | 2.0 | 1.4 | 838 | 2.3 |
| Race White |
908 | 0.3 | 6.9 | 1,021 | 0.4 |
| Race Black |
175 | 0.6 | 2.1 | 194 | 0.7 |
| Sex Female |
523 | 0.3 | 4.3 | 588 | 0.3 |
| Sex Male |
592 | 0.5 | 5.0 | 667 | 0.5 |
| Total | 1,115 | 0.4 | 9.3 | 1,255 | 0.4 |
Figure 3. Cancer of the Small Intestine: Age-Adjusted Rates of Death in the United States, 1979–2004
This content is provided as a service of the National Institute of Diabetes and Digestive and Kidney Diseases
(NIDDK), part of the National Institutes of Health. NIDDK translates and disseminates research findings to increase knowledge and understanding about health and disease among patients, health professionals, and the public. Content produced by NIDDK is carefully reviewed by NIDDK scientists and other experts.