

Chapter 20: Diverticular Disease
James E. Everhart, M.D., M.P.H.
Under ICD-10, diverticular disease is coded by anatomical site (small intestine, large intestine, both, or unspecified), although nearly all disease occurs in the large intestine, and by complication (perforation, abscess, or peritonitis). Under ICD-9, complications are not listed, but would presumably fall under diverticulitis, which is not a code under ICD-10.
In 2004, diverticular disease was the fifth most common reason for ambulatory care visits, after GERD, constipation, abdominal wall hernia, and hemorrhoids. Diverticular disease is generally considered a disease of the elderly, a belief that is consistent with medical care statistics (Table 1). Rates of ambulatory care visits increased with age, such that half of all visits for diverticular disease were for persons age 65 years and older. Age-adjusted rates were 18 percent higher among whites than blacks and 49 percent higher among women than men. Among digestive diseases, diverticular disease was also one of the most common reasons for hospitalization, with 313,000 first-listed and 815,000 all-listed diagnoses. Rates of hospitalization by demographic groups were similar to those of ambulatory care visits, although blacks had a higher rate than whites.
Ambulatory care visits with a diagnosis of diverticular disease increased about 18 percent between 1992–1993 and 2003–2005 (Figure 1). The rate of hospitalizations with a diagnosis of diverticular disease declined from 1982 until 1989, as it did for other digestive diseases. After several years of minimal change, rates began to increase slightly at the end of the 1990s, rising 16.4 percent between 1996 and 2004.
Diverticular disease was listed as the underlying cause of death among about 58 percent of certificates on which it was listed (Table 2). Nearly 90 percent of underlying cause of deaths occurred among persons age 65 years and older, resulting in an average of only 2.5 YPLL prior to age 75 per death. Age-adjusted death rates were modestly higher among whites and females. Mortality rates as underlying cause of death declined steadily by a total of 35 percent from 1980 through 2004 (Figure 2), which continued a decline begun in 1970 or earlier.18
In 2004, there were an estimated 2.8 million prescriptions at a cost of $100 million filled at retail pharmacies for diagnosis of diverticular disease (Table 3), according to the Verispan database (Appendix 2). All 10 costliest medications were for either antimicrobial agents (ciprofloxacin being the costliest and most common) or pain-relievers, led by morphine.
References
Table 1. Diverticular Disease: Number and Age-Adjusted Rates of Ambulatory Care Visits and Hospital Discharges With First-Listed and All-Listed Diagnoses by Age, Race, and Sex in the United States, 2004
| Demographic Characteristics | Ambulatory Care Visits First-Listed Diagnosis Number in Thousands | Ambulatory Care Visits First-Listed Diagnosis Rate per 100,000 | Ambulatory Care Visits All-Listed Diagnosis Number in Thousands | Ambulatory Care Visits All-Listed Diagnosis Rate per 100,000 | Hospital Discharges First-Listed Diagnosis Number in Thousands | Hospital Discharges First-Listed Diagnosis Rate per 100,000 | Hospital Discharges All-Listed Diagnosis Number in Thousands | Hospital Discharges All-Listed Diagnosis Rate per 100,000 |
|---|---|---|---|---|---|---|---|---|
| AGE (Years) Under 15 |
— | — | — | — | — | — | — | — |
| AGE (Years) 15–44 |
280 | 222 | 329 | 261 | 39 | 31 | 59 | 47 |
| AGE (Years) 45–64 |
622 | 879 | 1,239 | 1,753 | 101 | 142 | 212 | 299 |
| AGE (Years) 65+ |
947 | 2,607 | 1,686 | 4,641 | 173 | 477 | 544 | 1,498 |
| Race White |
1,609 | 627 | 2,878 | 1,115 | 252 | 99 | 668 | 258 |
| Race Black |
143 | 481 | 264 | 945 | 30 | 110 | 79 | 291 |
| Sex Female |
1,284 | 785 | 2,109 | 1,293 | 181 | 108 | 493 | 288 |
| Sex Male |
580 | 434 | 1,160 | 865 | 131 | 99 | 321 | 251 |
| Total | 1,864 | 635 | 3,269 | 1,113 | 313 | 107 | 815 | 278 |
Figure 1. Diverticular Disease: Age-Adjusted Rates of Ambulatory Care Visits and Hospital Discharges With All–Listed Diagnoses in the United States, 1979–2004
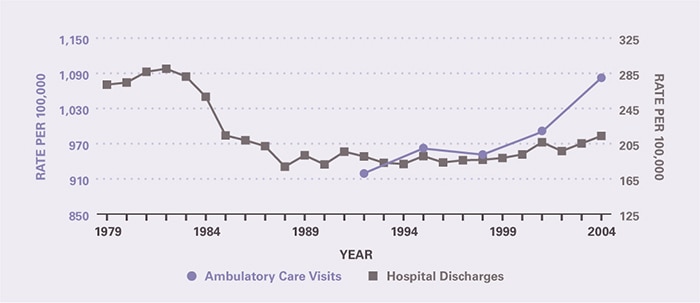
Table 2. Diverticular Disease: Number and Age-Adjusted Rates of Deaths and Years of Potential Life Lost (to Age 75) by Age, Race, and Sex in the United States, 2004
| Demographic Characteristics | Underlying Cause Number of Deaths | Underlying Cause Rate per 100,000 | Underlying Cause Years of Potential Life Lost in Thousands | Underlying or Other Cause Number of Deaths | Underlying or Other Cause Rate per 100,000 |
|---|---|---|---|---|---|
| AGE (Years) Under 15 |
— | — | — | — | — |
| AGE (Years) 15–44 |
39 | 0.0 | 1.4 | 58 | 0.0 |
| AGE (Years) 45–64 |
306 | 0.4 | 5.1 | 505 | 0.7 |
| AGE (Years) 65+ |
3,027 | 8.3 | 2.1 | 5,238 | 14.4 |
| Race White |
3,084 | 1.2 | 7.2 | 5,308 | 2.0 |
| Race Black |
243 | 1.0 | 1.1 | 410 | 1.7 |
| Sex Female |
2,299 | 1.2 | 4.2 | 3,867 | 2.1 |
| Sex Male |
1,073 | 0.9 | 4.4 | 1,934 | 1.7 |
| Total | 3,372 | 1.1 | 8.6 | 5,801 | 2.0 |
Figure 2. Diverticular Disease: Age-Adjusted Rates of Death in the United States, 1979–2004
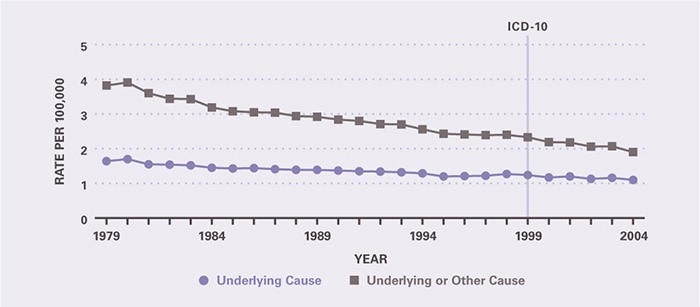
Table 3. Diverticular Disease: Costliest Prescriptions
| DRUG | Prescription (#) | Prescription | Retail Cost | Cost |
|---|---|---|---|---|
| Ciprofloxacin | 563,520 | 20.2% | $32,814,344 | 32.7% |
| Morphine | 788,714 | 28.3 | 22,240,858 | 22.2 |
| Levofloxacin | 221,943 | 8.0 | 20,204,227 | 20.2 |
| Metronidazole | 745,223 | 26.7 | 11,416,565 | 11.4 |
| Amoxicillin/Clavulanate | 125,629 | 4.5 | 6,411,362 | 6.4 |
| Hydrocodone/Acetaminophen | 187,977 | 6.7 | 1,640,576 | 1.6 |
| Oxycodone/Acetaminophen | 47,534 | 1.7 | 1,190,000 | 1.2 |
| Cephalexin | 36,199 | 1.3 | 715,276 | 0.7 |
| Ibuprofen/Hydrocodone | 15,994 | 0.6 | 703,984 | 0.7 |
| Moxifloxacin | 5,577 | 0.2 | 611,465 | 0.6 |
| Other | 51,210 | 1.7 | 2,281,170 | 2.3 |
| Total | 2,789,520 | 100.0% | $100,229,827 | 100.0% |