

Chapter 6: Cancer of the Stomach
James E. Everhart, M.D., M.P.H.
SEER includes cancers of the gastroesophageal junction and gastric cardia with gastric cancer. Over the period 1979 to 2004, the incidence of cancers of the gastroesophageal junction and cardia approximately doubled, resulting in an increase in the proportion of gastric cancer at these sites from 14.9% in 1979 to 30.4% in 2004. However, for medical care and vital statistics, these sites were included with esophageal cancer.
In 2004, the stomach was the third most common anatomical site for digestive system cancer, after the colon/rectum and the pancreas. Cancer of the stomach, gastric cancer, had an older age distribution than did other GI cancers, with 68 percent of cases having occurred at age 65 years or older (Table 1). Median age of diagnosis was 71 years (PDF, 28 KB) . Asians and Hispanics had the highest age-adjusted incidence rates; non-Hispanic whites had the lowest rate. The incidence of gastric cancer, as reflected by mortality rates, has been declining for more than 70 years in the United States. Between 1979 and 2004, the incidence declined more than one-third (Figure 1).
During that period, 5-year survival following diagnosis increased by 50 percent.
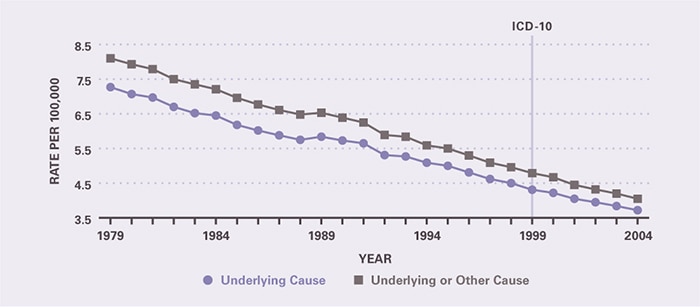
Ambulatory care visits and hospital discharges with gastric cancer were relatively insubstantial (Table 2). Hospitalization rates declined more rapidly than the incidence rate (Figure 2). Because gastric cancer now has somewhat better survival than other digestive system cancers, it was only the fourth leading cause of death among these cancers. Seventy percent of deaths with gastric cancer as the underlying cause occurred at age 65 years or older (Table 3). The large majority of deaths listed gastric cancer as the underlying cause. Age-adjusted mortality rates were more than twice as high among blacks as whites and nearly twice as high among men as women. If cancer of the gastroesophageal junction were included among gastric cancer, the number of deaths would have increased 5.6 percent to 11,883 in 2004. Reflecting the declining incidence rate and longer survival, the age-adjusted mortality rate of gastric cancer declined by 49 percent between 1979 and 2004 (Figure 3), the most rapid decline for any major digestive system cancer.
Table 1. Gastric Cancer: Number of Cases and Incidence Rates by Age, Race/Ethnicity, and Sex, 2004
| Demographic Characteristics | Number of Cases | Incidence per 100,000 Unadjusted | Incidence per 100,000 Age-Adjusted |
|---|---|---|---|
| AGE (Years) Under 15 |
— | — | — |
| AGE (Years) 15–44 |
1,292 | 1.1 | — |
| AGE (Years) 45–64 |
6,610 | 9.4 | — |
| AGE (Years) 65+ |
14,617 | 42.7 | — |
| RACE/ETHNICITY Non-Hispanic White |
14,224 | 7.4 | 6.2 |
| RACE/ETHNICITY Non-Hispanic Black |
2,727 | 8.0 | 11.4 |
| RACE/ETHNICITY Hispanic |
2,425 | 6.0 | 12.3 |
| RACE/ETHNICITY Asian/Pacific Islander |
1,419 | 11.5 | 13.8 |
| RACE/ETHNICITY American Indian/Alaska Native |
123 | 6.6 | 9.1 |
| Sex Female |
8,579 | 5.9 | 5.5 |
| Sex Male |
12,888 | 9.2 | 11.1 |
| Total | 21,519 | 7.5 | — |
Figure 1. Gastric Cancer: Age-Adjusted Incidence Rates and 5-Year Survival Rates, 1979–2004
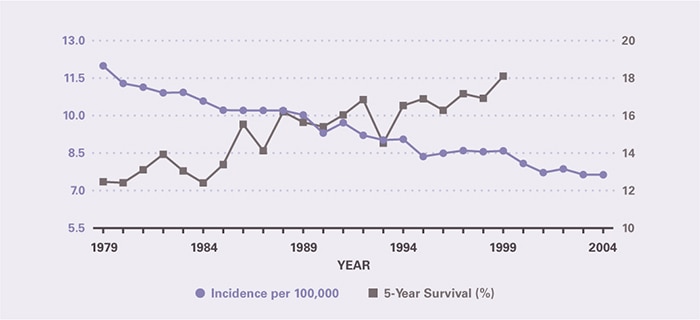
Table 2. Gastric Cancer: Number and Age-Adjusted Rates of Ambulatory Care Visits and Hospital Discharges With First-Listed and All-Listed Diagnoses by Age, Race, and Sex in the United States, 2004
| Demographic Characteristics | Ambulatory Care Visits First-Listed Diagnosis Number in Thousands | Ambulatory Care Visits First-Listed Diagnosis Rate per 100,000 | Ambulatory Care Visits All-Listed Diagnosis Number in Thousands | Ambulatory Care Visits All-Listed Diagnosis Rate per 100,000 | Hospital Discharges First-Listed Diagnosis Number in Thousands | Hospital Discharges First-Listed Diagnosis Rate per 100,000 | Hospital Discharges All-Listed Diagnosis Number in Thousands | Hospital Discharges All-Listed Diagnosis Rate per 100,000 |
|---|---|---|---|---|---|---|---|---|
| AGE (Years) Under 15 |
— | — | — | — | — | — | — | — |
| AGE (Years) 15–44 |
— | — | — | — | 1 | 1 | 3 | 2 |
| AGE (Years) 45–64 |
— | — | — | — | 5 | 7 | 10 | 14 |
| AGE (Years) 65+ |
— | — | 107 | 295 | 10 | 29 | 19 | 52 |
| Race White |
— | — | 99 | 40 | 11 | 4 | 21 | 8 |
| Race Black |
— | — | — | — | 3 | 11 | 6 | 21 |
| Sex Female |
— | — | — | — | 7 | 4 | 14 | 8 |
| Sex Male |
— | — | 59 | 44 | 9 | 7 | 17 | 13 |
| Total | 137 | 47 | 141 | 48 | 17 | 6 | 31 | 11 |
Figure 2. Gastric Cancer: Age-Adjusted Rates of Ambulatory Care Visits and Hospital Discharges With All–Listed Diagnoses in the United States, 1979–2004
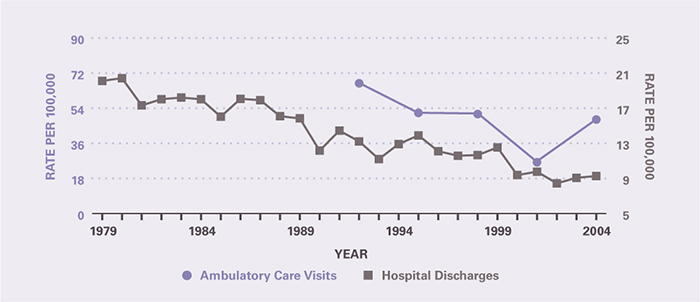
Table 3. Gastric Cancer: Number and Age-Adjusted Rates of Deaths and Years of Potential Life Lost (to Age 75) by Age, Race, and Sex in the United States, 2004
| Demographic Characteristics | Underlying Cause Number of Deaths | Underlying Cause Rate per 100,000 | Underlying Cause Years of Potential Life Lost in Thousands | Underlying or Other Cause Number of Deaths | Underlying or Other Cause Rate per 100,000 |
|---|---|---|---|---|---|
| AGE (Years) Under 15 |
— | — | — | — | — |
| AGE (Years) 15–44 |
573 | 0.5 | 20.7 | 585 | 0.5 |
| AGE (Years) 45–64 |
2,809 | 4.0 | 51.8 | 2,942 | 4.2 |
| AGE (Years) 65+ |
7,871 | 21.7 | 11.7 | 8,734 | 24.0 |
| Race White |
8,494 | 3.3 | 58.0 | 9,271 | 3.6 |
| Race Black |
2,008 | 7.5 | 18.7 | 2,177 | 8.1 |
| Sex Female |
4,791 | 2.8 | 32.9 | 5,197 | 3.0 |
| Sex Male |
6,462 | 5.2 | 51.3 | 7,064 | 5.7 |
| Total | 11,253 | 3.8 | 84.2 | 12,261 | 4.2 |
Figure 3. Gastric Cancer: Age-Adjusted Rates of Death in the United States, 1979–2004
This content is provided as a service of the National Institute of Diabetes and Digestive and Kidney Diseases
(NIDDK), part of the National Institutes of Health. NIDDK translates and disseminates research findings to increase knowledge and understanding about health and disease among patients, health professionals, and the public. Content produced by NIDDK is carefully reviewed by NIDDK scientists and other experts.