

Chapter 21: Liver Disease
James E. Everhart, M.D., M.P.H.
There are many causes of liver disease, and the underlying cause is not always clear from administrative data sets. Thus, this report does not break out cause-specific liver disease other than viral hepatitis and hepatocellular carcinoma. Because ICD-10 does not separate acute from chronic liver disease, ICD-9 codes for acute and chronic liver disease were combined to achieve consistency for time trend data (Appendix 1).
In 2004, liver disease was the ninth leading diagnosis at ambulatory care visits, with 2.4 million visits (Table 1). If combined with the 3.5 million visits with a diagnosis of viral hepatitis, then liver disease would have been the third leading diagnosis, after GERD and chronic constipation. All-listed visit rates for liver disease were highest at age 45–64 years. Age-adjusted rates were higher for blacks than whites and slightly higher among females. When listed as a hospital discharge, liver disease was first-listed diagnosis on only 24.4 percent of records. In 2004, liver disease was the third leading diagnosis on hospital discharge records, after only GERD and diverticular disease. Combined with 475,000 viral hepatitis diagnoses, liver disease would have been the second leading diagnosis, with 1.2 million. Rates increased with age and were higher among blacks and males. The rates of age-adjusted ambulatory care visits increased steadily between 1992–1993 and 2003–2005 (Figure 1), in contrast to the 1970s and 1980s, when they were relatively constant.19 Hospitalization rates were stable through the 1970s and fell throughout the 1980s, as was true for many other diseases.20 Between 1999 and 2004, the rate of hospitalization with a diagnosis of liver disease increased by more than a third.
In 2004, there were 36,000 deaths with liver disease listed as underlying cause, which was half the number of deaths with liver disease listed as underlying or other cause (Table 2). Among all digestive diseases, liver disease was the second leading cause of death, after colorectal cancer. Death from liver disease was most common among persons aged 45–64 years, although the mortality rate from liver disease was highest at age 65 years and older. As a result of the large number of deaths occurring at an early age, the YPLL prior to age 75 years was higher than for any other digestive disease. Mortality rates were slightly higher among whites than blacks, and were nearly twice as high among males. Beginning in 1970, through 2004, mortality from liver disease declined slowly but steadily (Figure 2).21 Between 1979 and 2004, liver disease mortality fell 30 percent. This rate of decline would have been halved had deaths from viral hepatitis been included.
According to the Verispan database of retail pharmacy prescriptions (Appendix 2), only three drugs (spironolactone, lactulose, and furosemide) were commonly prescribed for liver disease in 2004, for a total of 731,000 prescriptions at a cost of $16 million (Table 3). Spironolactone constituted 80 percent of both the number of prescriptions (583,000) and their cost ($12.8 million).
References
Table 1. Liver Disease: Number and Age-Adjusted Rates of Ambulatory Care Visits and Hospital Discharges With First-Listed and All-Listed Diagnoses by Age, Race, and Sex in the United States, 2004
| Demographic Characteristics | Ambulatory Care Visits First-Listed Diagnosis Number in Thousands | Ambulatory Care Visits First-Listed Diagnosis Rate per 100,000 | Ambulatory Care Visits All-Listed Diagnosis Number in Thousands | Ambulatory Care Visits All-Listed Diagnosis Rate per 100,000 | Hospital Discharges First-Listed Diagnosis Number in Thousands | Hospital Discharges First-Listed Diagnosis Rate per 100,000 | Hospital Discharges All-Listed Diagnosis Number in Thousands | Hospital Discharges All-Listed Diagnosis Rate per 100,000 |
|---|---|---|---|---|---|---|---|---|
| AGE (Years) Under 15 |
— | — | — | — | 2 | 2 | 9 | 14 |
| AGE (Years) 15–44 |
346 | 275 | 490 | 389 | 35 | 28 | 153 | 122 |
| AGE (Years) 45–64 |
665 | 941 | 1,374 | 1,944 | 102 | 144 | 365 | 517 |
| AGE (Years) 65+ |
358 | 986 | 503 | 1,385 | 47 | 129 | 233 | 640 |
| Race White |
1,122 | 446 | 1,903 | 749 | 149 | 59 | 596 | 236 |
| Race Black |
198 | 654 | 289 | 912 | 21 | 63 | 96 | 292 |
| Sex Female |
796 | 512 | 1,282 | 815 | 73 | 46 | 327 | 206 |
| Sex Male |
577 | 394 | 1,116 | 762 | 112 | 78 | 432 | 305 |
| Total | 1,373 | 468 | 2,398 | 816 | 185 | 63 | 759 | 259 |
Figure 1. Liver Disease: Age-Adjusted Rates of Ambulatory Care Visits and Hospital Discharges With All–Listed Diagnoses in the United States, 1979–2004
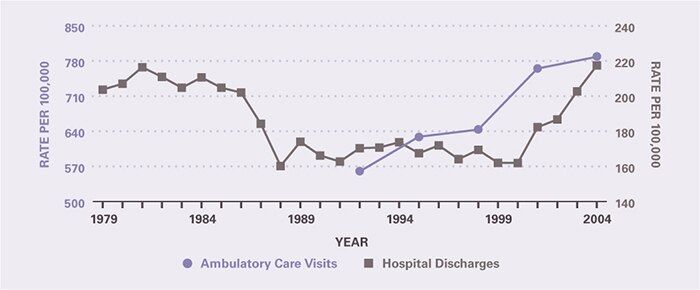
Table 2. Liver Disease: Number and Age-Adjusted Rates of Deaths and Years of Potential Life Lost (to Age 75) by Age, Race, and Sex in the United States, 2004
| Demographic Characteristics | Underlying Cause Number of Deaths | Underlying Cause Rate per 100,000 | Underlying Cause Years of Potential Life Lost in Thousands | Underlying or Other Cause Number of Deaths | Underlying or Other Cause Rate per 100,000 |
|---|---|---|---|---|---|
| AGE (Years) Under 15 |
146 | 0.2 | 10.7 | 491 | 0.8 |
| AGE (Years) 15–44 |
4,169 | 3.3 | 146.4 | 7,851 | 6.2 |
| AGE (Years) 45–64 |
18,154 | 25.7 | 367.6 | 35,259 | 49.9 |
| AGE (Years) 65+ |
13,620 | 37.5 | 34.4 | 29,486 | 81.2 |
| Race White |
31,041 | 12.1 | 462.8 | 61,685 | 24.1 |
| Race Black |
3,784 | 11.8 | 72.8 | 8,547 | 27.1 |
| Sex Female |
13,385 | 8.2 | 178.9 | 27,503 | 16.8 |
| Sex Male |
22,705 | 16.2 | 380.2 | 45,588 | 32.8 |
| Total | 36,090 | 12.3 | 559.1 | 73,091 | 24.9 |
Figure 2. Liver Disease: Age-Adjusted Rates of Death in the United States, 1979–2004
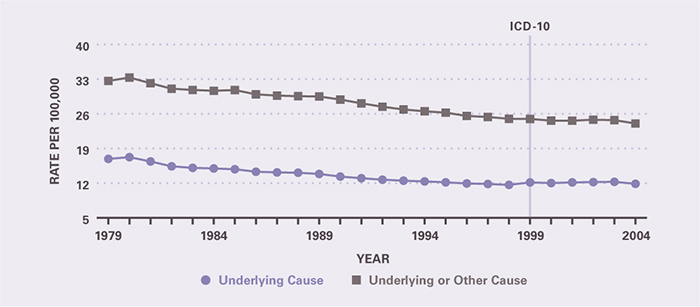
Table 3. Liver Disease: Costliest Prescriptions
| DRUG | Prescription (#) | Prescription | Retail Cost | Cost |
|---|---|---|---|---|
| Spironolactone | 583,486 | 79.8% | $12,838,400 | 80.0% |
| Lactulose | 115,294 | 15.8 | 3,006,568 | 18.7 |
| Furosemide | 32,450 | 4.4 | 208,205 | 1.3 |
| Total | 731,230 | 100.0% | $16,053,173 | 100.0% |