

Chapter 12: Cancer of the Pancreas
James E. Everhart, M.D., M.P.H.
In 2004, 71 percent of newly diagnosed pancreatic cancers were among persons age 65 years and older (Table 1). Age at diagnosis was higher than for most other digestive system cancers, with the median being 72 years and 40 percent diagnosed at age 75 years or older (PDF, 28KB) .
Incidence rates were highest among the elderly, non-Hispanic blacks, and males. Age-adjusted incidence was relatively stable from 1979 to 2004, being essentially the same in the first and last year (Figure 1). Survival from pancreatic cancer is the poorest of any major cancer, digestive system or otherwise. Nevertheless, 5-year survival increased modestly from 2 percent among persons diagnosed in 1979 to 3.8 percent among persons diagnosed in 1999.
In 2004, there were an estimated 415,000 ambulatory care visits for pancreatic cancer and 68,000 hospital discharges with a diagnosis of pancreatic cancer (Table 2). Hospitalization rates were highest among the elderly and age-adjusted rates were higher for blacks and males. While ambulatory care visits appear to have increased from 1992 through 2004, hospital discharge rates were stable from 1979 through 2004 (Figure 2).
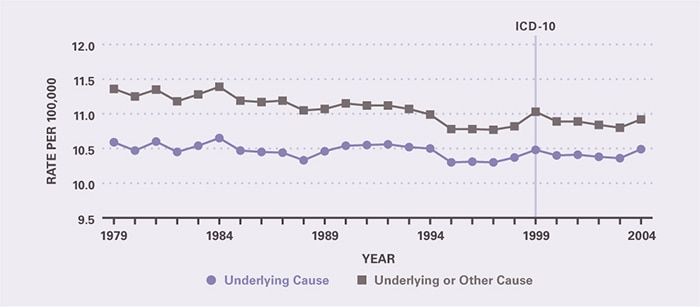
Because of low survival, pancreatic cancer mortality was essentially the same as incidence in 2004. As underlying cause, there were 31,800 deaths in 2004 (third highest of all digestive diseases) and more than 200,000 YPLL prior to age 75 years (also third highest of all digestive diseases) (Table 3). Rates were highest in the oldest age group. Age-adjusted mortality rates were higher for blacks and for males. Death rates for pancreatic cancer remained steady between 1979 and 2004 (Figure 3).
Table 1. Pancreatic Cancer: Number of Cases and Incidence Rates by Age, Race/Ethnicity, and Sex, 2004
| Demographic Characteristics | Number of Cases | Incidence per 100,000 Unadjusted | Incidence per 100,000 Age-Adjusted |
|---|---|---|---|
| AGE (Years) Under 15 |
— | — | — |
| AGE (Years) 15–44 |
878 | 0.7 | — |
| AGE (Years) 45–64 |
9,513 | 13.6 | — |
| AGE (Years) 65+ |
21,681 | 63.4 | — |
| RACE/ETHNICITY Non-Hispanic White |
25,873 | 13.5 | 11.2 |
| RACE/ETHNICITY Non-Hispanic Black |
3,614 | 10.6 | 15.2 |
| RACE/ETHNICITY Hispanic |
1,929 | 4.8 | 10.4 |
| RACE/ETHNICITY Asian/Pacific Islander |
947 | 7.7 | 9.2 |
| RACE/ETHNICITY American Indian/Alaska Native |
99 | 5.3 | 8.1 |
| Sex Female |
15,709 | 10.8 | 10.0 |
| Sex Male |
14,853 | 10.6 | 12.7 |
| Total | 30,560 | 10.7 | — |
Figure 1. Pancreatic Cancer: Age-Adjusted Incidence Rates and 5-Year Survival Rates, 1979–2004
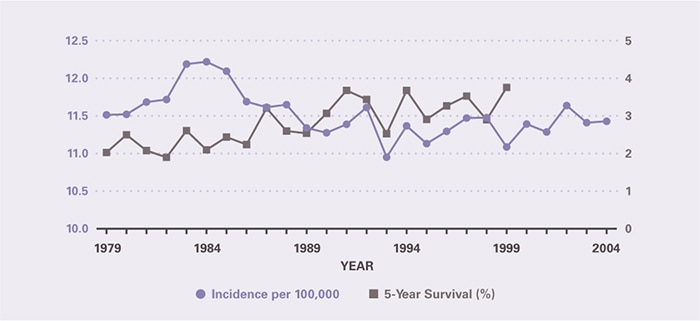
Table 2. Pancreatic Cancer: Number and Age-Adjusted Rates of Ambulatory Care Visits and Hospital Discharges With First-Listed and All-Listed Diagnoses by Age, Race, and Sex in the United States, 2004
| Demographic Characteristics | Ambulatory Care Visits First-Listed Diagnosis Number in Thousands | Ambulatory Care Visits First-Listed Diagnosis Rate per 100,000 | Ambulatory Care Visits All-Listed Diagnosis Number in Thousands | Ambulatory Care Visits All-Listed Diagnosis Rate per 100,000 | Hospital Discharges First-Listed Diagnosis Number in Thousands | Hospital Discharges First-Listed Diagnosis Rate per 100,000 | Hospital Discharges All-Listed Diagnosis Number in Thousands | Hospital Discharges All-Listed Diagnosis Rate per 100,000 |
|---|---|---|---|---|---|---|---|---|
| AGE (Years) Under 15 |
— | — | — | — | — | — | — | — |
| AGE (Years) 15–44 |
— | — | — | — | 1 | 1 | 2 | 2 |
| AGE (Years) 45–64 |
154 | 218 | 162 | 229 | 12 | 16 | 23 | 33 |
| AGE (Years) 65+ |
230 | 634 | 251 | 690 | 21 | 59 | 43 | 119 |
| Race White |
383 | 148 | 409 | 158 | 28 | 11 | 55 | 21 |
| Race Black |
— | — | — | — | 4 | 15 | 8 | 30 |
| Sex Female |
214 | 129 | 237 | 144 | 17 | 10 | 34 | 20 |
| Sex Male |
173 | 124 | 178 | 128 | 17 | 13 | 34 | 26 |
| Total | 386 | 132 | 415 | 141 | 34 | 12 | 68 | 23 |
Figure 2. Pancreatic Cancer: Age-Adjusted Rates of Ambulatory Care Visits and Hospital Discharges With All–Listed Diagnoses in the United States, 1979–2004
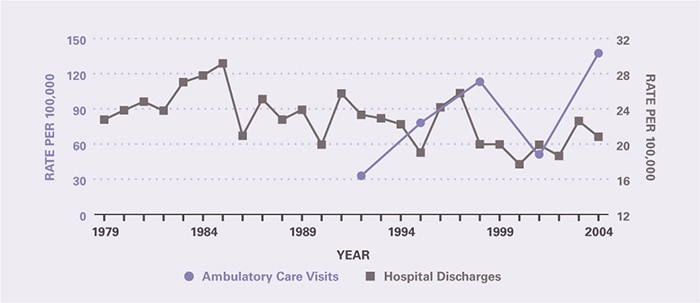
Table 3. Pancreatic Cancer: Number and Age-Adjusted Rates of Deaths and Years of Potential Life Lost (to Age 75) by Age, Race, and Sex in the United States, 2004
| Demographic Characteristics | Underlying Cause Number of Deaths | Underlying Cause Rate per 100,000 | Underlying Cause Years of Potential Life Lost in Thousands | Underlying or Other Cause Number of Deaths | Underlying or Other Cause Rate per 100,000 |
|---|---|---|---|---|---|
| AGE (Years) Under 15 |
— | — | — | 1 | 0.0 |
| AGE (Years) 15–44 |
596 | 0.5 | 20.6 | 606 | 0.5 |
| AGE (Years) 45–64 |
8,407 | 11.9 | 147.9 | 8,656 | 12.2 |
| AGE (Years) 65+ |
22,796 | 62.7 | 38.2 | 23,825 | 65.6 |
| Race White |
27,247 | 10.5 | 167.8 | 28,323 | 10.9 |
| Race Black |
3,681 | 13.7 | 31.9 | 3,848 | 14.3 |
| Sex Female |
16,004 | 9.2 | 83.3 | 16,602 | 9.6 |
| Sex Male |
15,796 | 12.4 | 123.5 | 16,487 | 12.9 |
| Total | 31,800 | 10.8 | 206.8 | 33,089 | 11.3 |
Figure 3. Pancreatic Cancer: Age-Adjusted Rates of Death in the United States, 1979–2004
This content is provided as a service of the National Institute of Diabetes and Digestive and Kidney Diseases
(NIDDK), part of the National Institutes of Health. NIDDK translates and disseminates research findings to increase knowledge and understanding about health and disease among patients, health professionals, and the public. Content produced by NIDDK is carefully reviewed by NIDDK scientists and other experts.