Chapter 19: Inflammatory Bowel Disease
James E. Everhart, M.D., M.P.H.
The two inflammatory bowel diseases (IBD) are Crohn’s disease (also known as regional enteritis) and ulcerative colitis (UC). Adding the data for the two results in the number of ambulatory care visits, hospital discharge diagnoses, and deaths for all IBD. (Tables and figures also are shown for all IBD, but not discussed.) Most care for these chronic diseases occurs in the outpatient setting, with hospitalizations reserved for complications that might require surgery. Mortality is relatively uncommon, such that death due to GERD is more common than death due to IBD. The significant suffering from IBD is not captured well in such statistics.
CROHN’S DISEASE
In 2004, Crohn’s disease resulted in more than 800,000 first-listed ambulatory care visits and more than 1 million all-listed visits (Table 1). Although Crohn’s disease affects both children and older adults, more than 80 percent of visits were among young and middle-aged adults. Visits were most common among whites, and there were similar rates for males and females. Crohn’s disease was the first-listed diagnosis at 57,000 hospital discharges and was mentioned as another diagnosis on nearly 100,000 other discharges. Rates increased modestly with age among adults and were higher for whites and females.
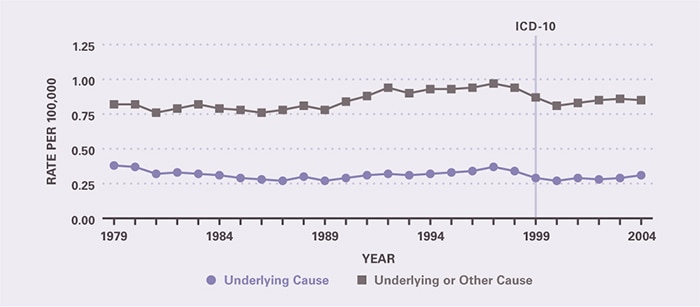
Age-adjusted rates of ambulatory care visits increased from 1992–1993 through 2003–2005 by 74 percent (Figure 1), continuing a trend that began at least as early as 1985, when the rate of office-based visits was 185 per 100,000 population.16 Rates of hospitalization were relatively stable from 1979 through the early 1990s, but then increased modestly. Crohn’s disease was uncommonly listed as the underlying cause of death in 2004, and more often as a contributing cause (Table 2). Rates increased with age and did not differ greatly by race or by sex. Between 1979 and 2004, mortality for Crohn’s disease as underlying cause changed little, but as underlying or other cause increased by 53 percent (Figure 2).
According to the Verispan database of prescriptions filled at retail pharmacies (Appendix 2), mesalamine was the costliest and most frequently prescribed medication for Crohn’s disease (Table 3), although not approved for this condition. Mesalamine was one of several nonspecific anti-inflammatory agents prescribed. The exception was infliximab, a monoclonal antibody for which there was a considerable cost for the modest number of prescriptions.
ULCERATIVE COLITIS
In 2004, there were about one-half million first-listed ambulatory care visits for UC and about 700,000 all-listed visits (Table 4). Visit rates were highest among young adults, and women had almost twice the rate of men. Visits were not frequent enough among other groups to provide reliable data. Hospitalizations were relatively uncommon, with 35,000 first-listed discharge diagnoses and 82,000 all-listed diagnoses.
Ambulatory care rates for UC may have increased between 1992–1993 and 2003–2005 (Figure 3), but not nearly as much as for Crohn’s disease. Hospitalization rates with a discharge diagnosis of UC were relatively stable for many years, as far back as 1970, but then increased 67 percent in just 5 years, 1999–2004.17 UC was uncommonly listed as the underlying cause of death in 2004, and more often as a contributing cause (Table 5). Mortality rates did not change between 1979 and 2004, except for a sharp drop in 1999, the year that ICD-10 was instituted for mortality coding (Figure 4).
According to the Verispan database of prescriptions filled at retail pharmacies, mesalamine and its prodrug balsalazide accounted for the majority of prescriptions and three-quarters of the prescription cost for UC (Table 6). Comparing Crohn’s disease and UC, the number of prescriptions and their costs were very similar, as were the actual drugs prescribed. The major difference was that UC was treated with fewer drugs. A significant limitation of the drug data is a lack of information on infusion biologics, which have become an important and expensive treatment for IBD.
References
Table 1. Crohn’s Disease: Number and Age-Adjusted Rates of Ambulatory Care Visits and Hospital Discharges With First-Listed and All-Listed Diagnoses by Age, Race, and Sex in the United States, 2004
| Demographic Characteristics | Ambulatory Care Visits First-Listed Diagnosis Number in Thousands | Ambulatory Care Visits First-Listed Diagnosis Rate per 100,000 | Ambulatory Care Visits All-Listed Diagnosis Number in Thousands | Ambulatory Care Visits All-Listed Diagnosis Rate per 100,000 | Hospital Discharges First-Listed Diagnosis Number in Thousands | Hospital Discharges First-Listed Diagnosis Rate per 100,000 | Hospital Discharges All-Listed Diagnosis Number in Thousands | Hospital Discharges All-Listed Diagnosis Rate per 100,000 |
|---|---|---|---|---|---|---|---|---|
| AGE (Years) Under 15 |
— | — | — | — | 2 | 3 | 3 | 5 |
| AGE (Years) 15–44 |
405 | 322 | 505 | 401 | 33 | 26 | 64 | 51 |
| AGE (Years) 45–64 |
304 | 430 | 455 | 644 | 15 | 21 | 44 | 63 |
| AGE (Years) 65+ |
— | — | — | — | 7 | 18 | 30 | 82 |
| Race White |
729 | 299 | 1,050 | 425 | 46 | 19 | 117 | 48 |
| Race Black |
— | — | — | — | 6 | 15 | 12 | 34 |
| Sex Female |
462 | 315 | 665 | 444 | 32 | 22 | 84 | 55 |
| Sex Male |
385 | 266 | 512 | 369 | 24 | 16 | 57 | 40 |
| Total | 847 | 288 | 1,176 | 401 | 57 | 19 | 141 | 48 |
Figure 1. Crohn’s Disease: Age-Adjusted Rates of Ambulatory Care Visits and Hospital Discharges With All–Listed Diagnoses in the United States, 1979–2004
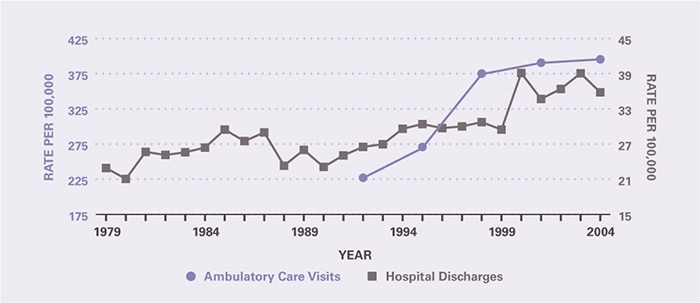
Table 2. Crohn’s Disease: Number and Age-Adjusted Rates of Deaths and Years of Potential Life Lost (to Age 75) by Age, Race, and Sex in the United States, 2004
| Demographic Characteristics | Underlying Cause Number of Deaths | Underlying Cause Rate per 100,000 | Underlying Cause Years of Potential Life Lost in Thousands | Underlying or Other Cause Number of Deaths | Underlying or Other Cause Rate per 100,000 |
|---|---|---|---|---|---|
| AGE (Years) Under 15 |
1 | 0.0 | 0.1 | 2 | 0.0 |
| AGE (Years) 15–44 |
70 | 0.1 | 2.8 | 137 | 0.1 |
| AGE (Years) 45–64 |
195 | 0.3 | 3.7 | 473 | 0.7 |
| AGE (Years) 65+ |
356 | 1.0 | 0.5 | 973 | 2.7 |
| Race White |
573 | 0.2 | 6.0 | 1,473 | 0.6 |
| Race Black |
44 | 0.1 | 0.9 | 102 | 0.3 |
| Sex Female |
371 | 0.2 | 3.5 | 886 | 0.5 |
| Sex Male |
251 | 0.2 | 3.6 | 699 | 0.5 |
| Total | 622 | 0.2 | 7.0 | 1,585 | 0.5 |
Figure 2. Crohn’s Disease: Age-Adjusted Rates of Death in the United States, 1979–2004
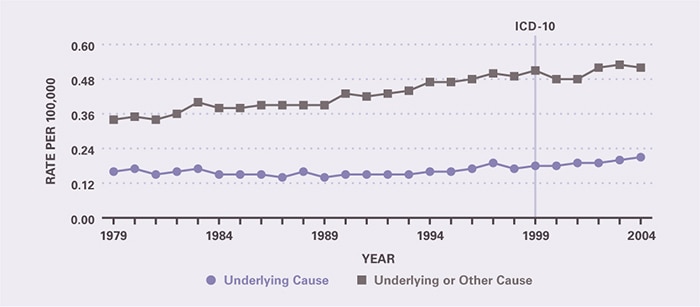
Table 3. Crohn’s Disease: Costliest Prescriptions
| DRUG | Prescription (#) | Prescription | Retail Cost | Cost |
|---|---|---|---|---|
| Mesalamine | 701,941 | 37.4% | $180,555,504 | 69.0% |
| Mercaptopurine | 182,978 | 9.7 | 29,004,965 | 11.1 |
| Azathioprine | 369,377 | 19.7 | 19,433,538 | 7.4 |
| Budesonide | 75,949 | 4.0 | 17,236,094 | 6.6 |
| Prednisone | 420,924 | 22.4 | 6,931,980 | 2.7 |
| Sulfasalazine | 112,215 | 6.0 | 4,230,607 | 1.6 |
| Infliximab | 986 | 0.1 | 2,072,089 | 0.8 |
| Balsalazide | 5,260 | 0.3 | 1,382,994 | 0.5 |
| Methylprednisolone | 6,615 | 0.4 | 337,040 | 0.1 |
| Olsalazine | 2,123 | 0.1 | 319,852 | 0.1 |
| Total | 1,878,368 | 100.0% | $261,504,663 | 100.0% |
Table 4. Ulcerative Colitis: Number and Age-Adjusted Rates of Ambulatory Care Visits and Hospital Discharges With First-Listed and All-Listed Diagnoses by Age, Race, and Sex in the United States, 2004
| Demographic Characteristics | Ambulatory Care Visits First-Listed Diagnosis Number in Thousands | Ambulatory Care Visits First-Listed Diagnosis Rate per 100,000 | Ambulatory Care Visits All-Listed Diagnosis Number in Thousands | Ambulatory Care Visits All-Listed Diagnosis Rate per 100,000 | Hospital Discharges First-Listed Diagnosis Number in Thousands | Hospital Discharges First-Listed Diagnosis Rate per 100,000 | Hospital Discharges All-Listed Diagnosis Number in Thousands | Hospital Discharges All-Listed Diagnosis Rate per 100,000 |
|---|---|---|---|---|---|---|---|---|
| AGE (Years) Under 15 |
— | — | — | — | 1 | 2 | 2 | 3 |
| AGE (Years) 15–44 |
— | — | 205 | 163 | 16 | 13 | 29 | 23 |
| AGE (Years) 45–64 |
— | — | — | — | 10 | 14 | 24 | 34 |
| AGE (Years) 65+ |
— | — | — | — | 8 | 23 | 27 | 75 |
| Race White |
435 | 173 | 582 | 230 | 29 | 12 | 70 | 28 |
| Race Black |
— | — | — | — | 3 | 8 | 6 | 18 |
| Sex Female |
306 | 201 | 483 | 308 | 19 | 12 | 45 | 28 |
| Sex Male |
— | — | 232 | 162 | 16 | 11 | 37 | 27 |
| Total | 513 | 175 | 716 | 244 | 35 | 12 | 82 | 28 |
Figure 3. Ulcerative Colitis: Age-Adjusted Rates of Ambulatory Care Visits and Hospital Discharges With All–Listed Diagnoses in the United States, 1979–2004
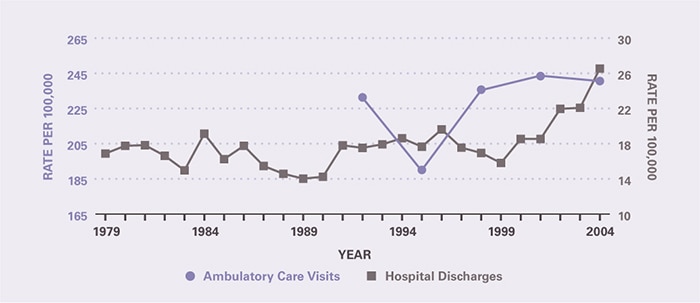
Table 5. Ulcerative Colitis: Number and Age-Adjusted Rates of Deaths and Years of Potential Life Lost (to Age 75) by Age, Race, and Sex in the United States, 2004
| Demographic Characteristics | Underlying Cause Number of Deaths | Underlying Cause Rate per 100,000 | Underlying Cause Years of Potential Life Lost in Thousands | Underlying or Other Cause Number of Deaths | Underlying or Other Cause Rate per 100,000 |
|---|---|---|---|---|---|
| AGE (Years) Under 15 |
— | — | — | 2 | 0.0 |
| AGE (Years) 15–44 |
17 | 0.0 | 0.7 | 65 | 0.1 |
| AGE (Years) 45–64 |
56 | 0.1 | 1.0 | 166 | 0.2 |
| AGE (Years) 65+ |
238 | 0.7 | 0.3 | 757 | 2.1 |
| Race White |
291 | 0.1 | 1.7 | 930 | 0.4 |
| Race Black |
18 | 0.1 | 0.3 | 54 | 0.2 |
| Sex Female |
168 | 0.1 | 0.9 | 502 | 0.3 |
| Sex Male |
143 | 0.1 | 1.1 | 488 | 0.4 |
| Total | 311 | 0.1 | 2.0 | 990 | 0.3 |
Figure 4. Ulcerative Colitis: Age-Adjusted Rates of Death in the United States, 1979–2004
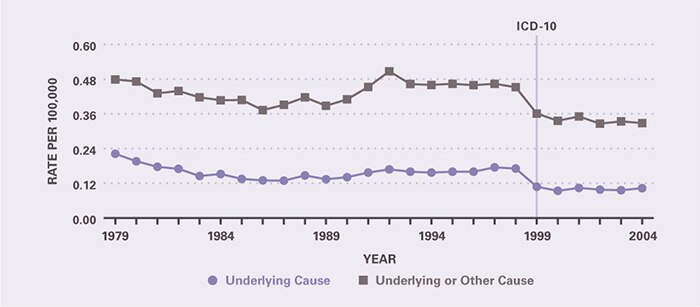
Table 6. Ulcerative Colitis: Costliest Prescriptions
| DRUG | Prescription (#) | Prescription | Retail Cost | Cost |
|---|---|---|---|---|
| Mesalamine | 1,080,775 | 49.5% | $177,226,718 | 65.0% |
| Balsalazide | 213,951 | 9.8 | 57,138,781 | 20.9 |
| Sulfasalazine | 464,152 | 21.3 | 19,986,261 | 7.3 |
| Olsalazine | 57,143 | 2.6 | 9,955,396 | 3.6 |
| Prednisone | 350,182 | 16.1 | 4,821,998 | 1.8 |
| Budesonide | 15,419 | 0.7 | 3,733,906 | 1.4 |
| Total | 2,181,622 | 100.0% | $272,863,060 | 100.0% |
Table 7. All Inflammatory Bowel Disease: Number and Age-Adjusted Rates of Ambulatory Care Visits and Hospital Discharges With First-Listed and All-Listed Diagnoses by Age, Race, and Sex in the United States, 2004
| Demographic Characteristics | Ambulatory Care Visits First-Listed Diagnosis Number in Thousands | Ambulatory Care Visits First-Listed Diagnosis Rate per 100,000 | Ambulatory Care Visits All-Listed Diagnosis Number in Thousands | Ambulatory Care Visits All-Listed Diagnosis Rate per 100,000 | Hospital Discharges First-Listed Diagnosis Number in Thousands | Hospital Discharges First-Listed Diagnosis Rate per 100,000 | Hospital Discharges All-Listed Diagnosis Number in Thousands | Hospital Discharges All-Listed Diagnosis Rate per 100,000 |
|---|---|---|---|---|---|---|---|---|
| AGE (Years) Under 15 |
— | — | — | — | 3 | 6 | 5 | 8 |
| AGE (Years) 15–44 |
543 | 432 | 710 | 564 | 49 | 39 | 92 | 73 |
| AGE (Years) 45–64 |
486 | 688 | 677 | 958 | 25 | 35 | 68 | 96 |
| AGE (Years) 65+ |
— | — | 446 | 1,227 | 15 | 41 | 56 | 155 |
| Race White |
1,163 | 472 | 1,631 | 654 | 76 | 31 | 185 | 75 |
| Race Black |
— | — | 236 | 764 | 9 | 23 | 18 | 51 |
| Sex Female |
768 | 516 | 1,148 | 752 | 51 | 34 | 127 | 82 |
| Sex Male |
592 | 410 | 744 | 531 | 40 | 28 | 93 | 66 |
| Total | 1,359 | 463 | 1,892 | 644 | 92 | 31 | 221 | 75 |
Figure 5. All Inflammatory Bowel Disease: Age-Adjusted Rates of Ambulatory Care Visits and Hospital Discharges With All–Listed Diagnoses in the United States, 1979–2004
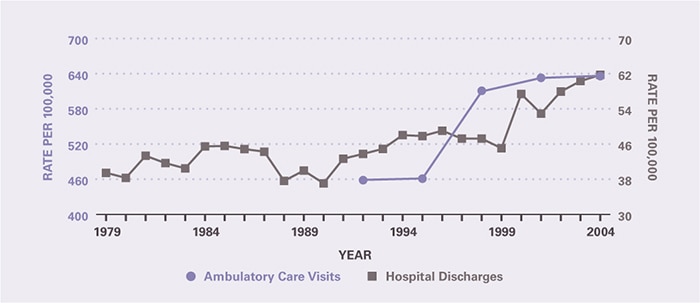
Table 8. All Inflammatory Bowel Disease: Number and Age-Adjusted Rates of Deaths and Years of Potential Life Lost (to Age 75) by Age, Race, and Sex in the United States, 2004
| Demographic Characteristics | Underlying Cause Number of Deaths | Underlying Cause Rate per 100,000 | Underlying Cause Years of Potential Life Lost in Thousands | Underlying or Other Cause Number of Deaths | Underlying or Other Cause Rate per 100,000 |
|---|---|---|---|---|---|
| AGE (Years) Under 15 |
1 | 0.0 | 0.1 | 4 | 0.0 |
| AGE (Years) 15–44 |
87 | 0.1 | 3.5 | 202 | 0.2 |
| AGE (Years) 45–64 |
251 | 0.4 | 4.8 | 636 | 0.9 |
| AGE (Years) 65+ |
594 | 1.6 | 0.7 | 1,729 | 4.8 |
| Race White |
864 | 0.3 | 7.7 | 2,399 | 0.9 |
| Race Black |
62 | 0.2 | 1.1 | 156 | 0.5 |
| Sex Female |
539 | 0.3 | 4.3 | 1,386 | 0.8 |
| Sex Male |
394 | 0.3 | 4.7 | 1,185 | 0.9 |
| Total | 933 | 0.3 | 9.1 | 2,571 | 0.9 |
Figure 6. All Inflammatory Bowel Disease: Age-Adjusted Rates of Death in the United States, 1979–2004