

Chapter 4: Digestive Cancers
James E. Everhart, M.D., M.P.H.
The Surveillance, Epidemiology, and End Results (SEER) program provides considerable information on cancer burden not available for other digestive diseases. SEER statistics used in this report are number of cases and incidence in 2004, and the time trends for incidence and 5-year survival following diagnosis between 1979 and 2004. The codes used by ICD-9, ICD-10, and SEER are listed in Appendix 1.
ALL DIGESTIVE SYSTEM CANCERS
In 2004, approximately 233,000 persons were diagnosed with digestive system cancers (Table 1), which represented 18 percent of all cancers and was second only to genital system cancers for the most commonly affected organ system. Two-thirds of digestive system cancers occurred among persons age 65 years and older. The median age of diagnosis was 70 years, compared with 67 years for all cancers (PDF, 28 KB) . Age-adjusted rates were highest among non-Hispanic blacks and lowest among American Indians. Males had slightly higher rates than females. Age-adjusted incidence declined by 13.2 percent between 1979 and 2004, with the entire decline coming after 1986 (Figure 1). Survival for all cancers and for individual cancers was calculated as absolute survival. Other reports may calculate survival relative to the general population with the same age and sex distribution, which would result in higher apparent survival. The same trends, however, would be seen for either approach. Five-year survival increased an absolute 6 percent to 34.6 percent; thus, for every 100 persons diagnosed with a digestive system cancer in 1999, 6 more survived at least 5 years longer than did those diagnosed 20 years earlier.
There were approximately 3.5 million ambulatory care visits for first-listed digestive system cancer in 2004 and 4.2 million all-listed visits. The elderly, whites, and males had the highest rates of ambulatory care visits (Table 2). Among all hospital discharges with digestive system cancers, about half were first-listed. The main demographic difference between ambulatory care diagnoses and hospital diagnoses was that blacks had a higher age-adjusted rate of hospital diagnoses. Rates of ambulatory care visits for digestive system cancers did not change appreciably over the period 1992–2004, but hospitalizations rates declined by 13.6 percent over that period (Figure 2).
In 2004, there were approximately 135,000 deaths due to digestive system cancers (Table 3), which represented 24 percent of all cancers and were second only to respiratory system cancers as cause of death due to cancer. As underlying cause, digestive system cancers constituted 57.2 percent of all digestive disease deaths. Death rates among persons 65 years and older were 5 times that of those aged 45–64 years. Age-adjusted death rates were higher among blacks and men. There were 945,000 YPLL due to digestive system cancer, the large majority occurring among males. Death rates from digestive system cancer declined steadily between 1979 and 2004 by an overall 19.8 percent (Figure 3).
MEDICATIONS
The costliest prescriptions filled at retail pharmacies for digestive system malignancies in 2004, according to the Verispan database (Appendix 2), are shown in Table 4. An estimated 879,000 outpatient prescriptions were filled. The costliest agents were either anti-neoplastic agents, such as capecitabine, or nonspecific pain and anti-nausea medications, such as fentanyl. Because the prescriptions were filled at retail pharmacies and do not capture all the settings where anti-cancer treatment is prescribed, this table both underestimates the number of prescriptions and likely misses many of the drugs used to treat digestive system malignancies. Medications are not shown for the individual malignancies in the following chapters.
Table 1. All Digestive Cancers: Number of Cases and Incidence Rates by Age, Race/Ethnicity, and Sex, 2004
| Demographic Characteristics | Number of Cases | Incidence per 100,000 Unadjusted | Incidence per 100,000 Age-Adjusted |
|---|---|---|---|
| AGE (Years) Under 15 |
293 | 0.5 | — |
| AGE (Years) 15–44 |
10,927 | 9.1 | — |
| AGE (Years) 45–64 |
78,215 | 111.6 | — |
| AGE (Years) 65+ |
154,886 | 452.8 | — |
| RACE/ETHNICITY Non-Hispanic White |
191,668 | 99.6 | 83.5 |
| RACE/ETHNICITY Non-Hispanic Black |
26,748 | 78.3 | 109.0 |
| RACE/ETHNICITY Hispanic |
15,921 | 39.3 | 81.8 |
| RACE/ETHNICITY Asian/Pacific Islander |
8,914 | 72.4 | 84.4 |
| RACE/ETHNICITY American Indian/Alaska Native |
1,009 | 54.5 | 75.0 |
| Sex Female |
109,058 | 74.7 | 70.0 |
| Sex Male |
123,967 | 88.7 | 105.1 |
| Total | 233,239 | 81.6 | — |
Figure 1. All Digestive Cancers: Age-Adjusted Incidence Rates and 5-Year Survival Rates, 1979–2004
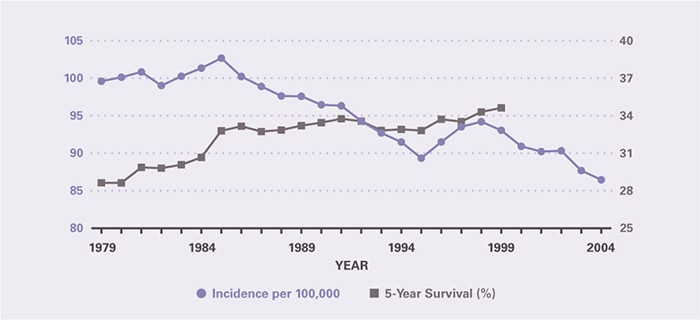
Table 2. All Digestive Cancers: Number and Age-Adjusted Rates of Ambulatory Care Visits and Hospital Discharges With First-Listed and All-Listed Diagnoses by Age, Race, and Sex in the United States, 2004
| Demographic Characteristics | Ambulatory Care Visits First-Listed Diagnosis Number in Thousands | Ambulatory Care Visits First-Listed Diagnosis Rate per 100,000 | Ambulatory Care Visits All-Listed Diagnosis Number in Thousands | Ambulatory Care Visits All-Listed Diagnosis Rate per 100,000 | Hospital Discharges First-Listed Diagnosis Number in Thousands | Hospital Discharges First-Listed Diagnosis Rate per 100,000 | Hospital Discharges All-Listed Diagnosis Number in Thousands | Hospital Discharges All-Listed Diagnosis Rate per 100,000 |
|---|---|---|---|---|---|---|---|---|
| AGE (Years) Under 15 |
— | — | — | — | 1 | 1 | 5 | 7 |
| AGE (Years) 15–44 |
110 | 87 | 145 | 115 | 19 | 15 | 47 | 37 |
| AGE (Years) 45–64 |
1,293 | 1,829 | 1,537 | 2,174 | 115 | 163 | 257 | 364 |
| AGE (Years) 65+ |
2,034 | 5,600 | 2,472 | 6,805 | 200 | 550 | 418 | 1,149 |
| Race White |
3,149 | 1,235 | 3,771 | 1,479 | 263 | 102 | 572 | 222 |
| Race Black |
240 | 802 | 313 | 1,040 | 40 | 141 | 89 | 307 |
| Sex Female |
1,740 | 1,081 | 2,218 | 1,375 | 167 | 100 | 374 | 226 |
| Sex Male |
1,741 | 1,309 | 1,980 | 1,485 | 168 | 128 | 351 | 267 |
| Total | 3,481 | 1,185 | 4,198 | 1,429 | 335 | 114 | 726 | 247 |
Figure 2. All Digestive Cancers: Age-Adjusted Rates of Ambulatory Care Visits and Hospital Discharges With All–Listed Diagnoses in the United States, 1979–2004
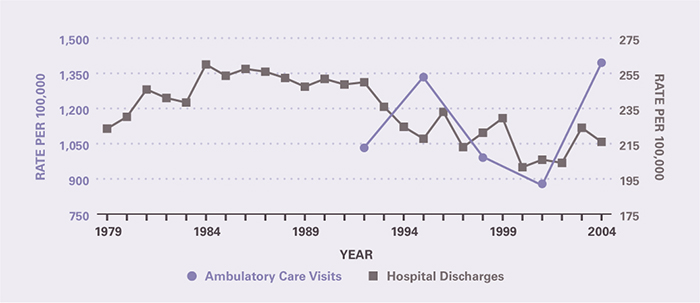
Table 3. All Digestive Cancers: Number and Age-Adjusted Rates of Deaths and Years of Potential Life Lost (to Age 75) by Age, Race, and Sex in the United States, 2004
| Demographic Characteristics | Underlying Cause Number of Deaths | Underlying Cause Rate per 100,000 | Underlying Cause Years of Potential Life Lost in Thousands | Underlying or Other Cause Number of Deaths | Underlying or Other Cause Rate per 100,000 |
|---|---|---|---|---|---|
| AGE (Years) Under 15 |
43 | 0.1 | 3.0 | 57 | 0.1 |
| AGE (Years) 15–44 |
3,972 | 3.2 | 142.7 | 4,549 | 3.6 |
| AGE (Years) 45–64 |
35,968 | 50.9 | 648.1 | 41,599 | 58.8 |
| AGE (Years) 65+ |
95,123 | 261.8 | 151.5 | 114,984 | 316.5 |
| Race White |
113,468 | 43.5 | 737.8 | 136,231 | 52.2 |
| Race Black |
16,907 | 62.2 | 161.7 | 19,587 | 72.3 |
| Sex Female |
61,515 | 35.4 | 346.5 | 74,315 | 42.7 |
| Sex Male |
73,592 | 57.9 | 598.7 | 86,876 | 68.8 |
| Total | 135,107 | 46.0 | 945.2 | 161,191 | 54.9 |
Figure 3. All Digestive Cancers: Age-Adjusted Rates of Death in the United States, 1979–2004
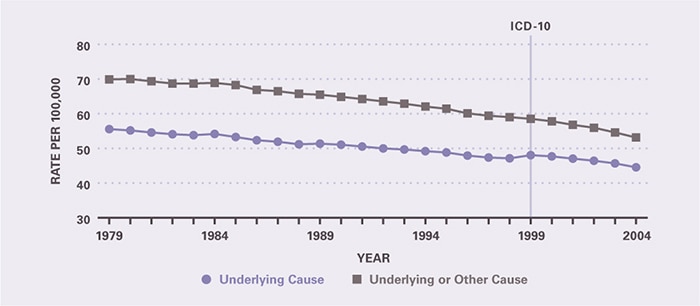
Table 4. All Digestive Cancers: Costliest Prescriptions
| DRUG | Prescription (#) | Prescription | Retail Cost | Cost |
|---|---|---|---|---|
| Capecitabine | 77,376 | 8.8% | $76,943,103 | 53.6% |
| Fentanyl | 80,768 | 9.2 | 21,519,990 | 15.0 |
| Oxycodone | 92,577 | 10.5 | 20,027,456 | 14.0 |
| Hydromorphone | 371,312 | 42.2 | 16,110,590 | 11.2 |
| Oxycodone/Acetaminophen | 215,506 | 24.5 | 4,516,077 | 3.1 |
| Morphine | 17,890 | 2.0 | 3,690,323 | 2.6 |
| Gemcitabine | 379 | 0.0 | 361,858 | 0.3 |
| Hydrocodone/Acetaminophen | 4,285 | 0.5 | 249,901 | 0.2 |
| Bevacizumab | 18 | 0.0 | 45,962 | 0.0 |
| Cetuximab | 15 | 0.0 | 27,876 | 0.0 |
| Other | 18,557 | 2.0 | 14,683 | 0.0 |
| Total | 878,683 | 100.0% | $143,507,819 | 100.0% |