

Chapter 16: Functional Intestinal Disorders
James E. Everhart, M.D., M.P.H.
Included in this chapter are separate entries on chronic constipation and irritable bowel syndrome (IBS). Other functional conditions that were either too uncommon or too nonspecific were functional diarrhea, neurogenic bowel and megacolon not elsewhere described, anal spasm, and other specified and unspecified functional intestinal disorders. These are included in the section All Functional Intestinal Disorders.
CHRONIC CONSTIPATION
In 2004, constipation was frequently noted at ambulatory care visits either as a first-listed diagnosis (3.1 million visits) or all-listed diagnoses (6.3 million visits) (Table 1), which made it the second most common ambulatory care diagnosis, after GERD. Persons under age 15 years had the highest number of visits for chronic constipation and nearly as great a rate as persons age 65 years and older. The number of ambulatory care visits for the younger age group was equal to that of intestinal infections (Chapter 2). Chronic constipation and GI infections were the two most common reasons for ambulatory care visits among children. Rates of visits with a chronic constipation diagnosis were also higher for blacks and for females. Hospitalizations with chronic constipation were uncommon, with first-listed diagnoses only 1–2 percent of ambulatory care visits. All-listed diagnoses of chronic constipation were more common—about one-tenth the rate of all-listed ambulatory care diagnoses. After many years of stable rates of medical care statistics for chronic constipation, there was a surge in both ambulatory medical care visits and hospitalizations between 1992 and 2004 (Figure 1), with more than a doubling of rates of ambulatory care diagnoses and nearly a fourfold increase in rates of hospital discharge diagnoses. The rate of ambulatory visits began to increase at least as early as 1985, when there were approximately 500 per 100,000 population.10
Mortality from chronic constipation is, of course, rare (Table 2). Nevertheless, in keeping with the increase in medical care, there was an increase in constipation as either underlying cause or underlying or other cause between 1989 and 2004 (Figure 2).
According to the Verispan database of retail pharmacy prescriptions (Appendix 2), in 2004, nearly half of all medications prescribed for chronic constipation were for the laxative polyethylene glycol (Table 3). Tegaserod (Zelnorm®), a medication for women with irritable bowel syndrome and constipation, was not as commonly prescribed, but was nearly as costly. Other medications were primarily stool softeners or motility agents. These data did not capture the very large number of nonprescription medications purchased for constipation.
IRRITABLE BOWEL SYNDROME
In 2004, there were 3 million ambulatory care visits with IBS noted as a diagnosis, and slightly more than half were first-listed diagnoses (Table 4). Unlike constipation, which was common among children, rates of visits with IBS increased with age only in later adulthood. Whites had more than twice the age-adjusted rate of visits as blacks. The rate of visits among females was more than 4 times that of males—the largest sex difference for any digestive disease. IBS was rarely noted as first-listed diagnosis on hospital discharge, but was much more commonly coded as a secondary diagnosis. The age, race, and sex patterns for all-listed discharge diagnosis were similar to ambulatory care diagnoses.
Age-adjusted rates of ambulatory care visits with an IBS diagnosis fell by about 20 percent between 1992–1993 and 2003–2005 (Figure 3), although the rate in the latest period was similar to rates in 1981, 1982, and 1985.11 In contrast, rates of hospital discharges with a diagnosis of IBS fell in the mid-1980s, leveled off through the mid-1990s, and then increased by 81 percent between 1999 and 2004. IBS as underlying or contributing cause of death was exceedingly rare (Table 5), and trend data were not meaningful (Figure 4).
According to the Verispan database of retail pharmacies, in 2004, tegaserod (Zelnorm®) contributed much to the cost of IBS and was the third most widely prescribed drug (Table 6). The anticholinergic drugs hyoscyamine and dicyclomine were the most commonly prescribed drugs.
ALL FUNCTIONAL INTESTINAL DISORDERS
As a group of conditions, functional disorders were common reasons for outpatient visits, such that there were estimated to be more than 11 million ambulatory care visits noting these diagnoses in 2004 (Table 7), or about 4 visits per every 100 persons in the United States. Eighty percent of these visits were for either chronic constipation or IBS. Hospitalizations for functional disorders were uncommon, but they did commonly appear as an all-listed diagnoses. Recent increases in diagnoses with a mention of functional disorders on ambulatory care visits and hospital discharge were almost entirely due to increased rates of diagnoses of constipation (Figure 5). Chronic constipation and IBS accounted for 73.5 percent of these diagnoses. Functional disorders were coded as an underlying cause of death for 423 persons in 2004, and listed as a contributing cause for 1,766 persons (Table 8). The death rate with mention of functional intestinal conditions was stable from 1979 to 1999, when the change to ICD-10 coding resulted in a 19 percent increase that was likely a coding artifact (Figure 6).
According to the Verispan database of retail pharmacies, in 2004, there were estimated to be more than 13 million prescriptions filled at retail pharmacies at a cost of nearly three-quarters of a billion dollars (Table 9). Nearly one-third of this cost was for tegaserod (Zelnorm®). Other agents were primarily for pain, including several acid-blocking agents, or for constipation.
References
Table 1. Chronic Constipation: Number and Age-Adjusted Rates of Ambulatory Care Visits and Hospital Discharges With First-Listed and All-Listed Diagnoses by Age, Race, and Sex in the United States, 2004
| Demographic Characteristics | Ambulatory Care Visits First-Listed Diagnosis Number in Thousands | Ambulatory Care Visits First-Listed Diagnosis Rate per 100,000 | Ambulatory Care Visits All-Listed Diagnosis Number in Thousands | Ambulatory Care Visits All-Listed Diagnosis Rate per 100,000 | Hospital Discharges First-Listed Diagnosis Number in Thousands | Hospital Discharges First-Listed Diagnosis Rate per 100,000 | Hospital Discharges All-Listed Diagnosis Number in Thousands | Hospital Discharges All-Listed Diagnosis Rate per 100,000 |
|---|---|---|---|---|---|---|---|---|
| AGE (Years) Under 15 |
1,175 | 1,933 | 2,127 | 3,497 | 5 | 8 | 32 | 53 |
| AGE (Years) 15–44 |
601 | 478 | 1,397 | 1,110 | 6 | 5 | 106 | 84 |
| AGE (Years) 45–64 |
492 | 696 | 1,112 | 1,572 | 8 | 11 | 164 | 231 |
| AGE (Years) 65+ |
880 | 2,423 | 1,671 | 4,599 | 18 | 50 | 399 | 1,097 |
| Race White |
2,582 | 1,064 | 5,057 | 2,100 | 28 | 11 | 534 | 209 |
| Race Black |
430 | 1,011 | 990 | 2,620 | 5 | 15 | 98 | 322 |
| Sex Female |
1,955 | 1,267 | 4,050 | 2,655 | 23 | 14 | 434 | 260 |
| Sex Male |
1,194 | 866 | 2,256 | 1,657 | 14 | 11 | 266 | 206 |
| Total | 3,149 | 1,072 | 6,306 | 2,148 | 37 | 13 | 700 | 238 |
Figure 1. Chronic Constipation: Age-Adjusted Rates of Ambulatory Care Visits and Hospital Discharges With All–Listed Diagnoses in the United States, 1979–2004
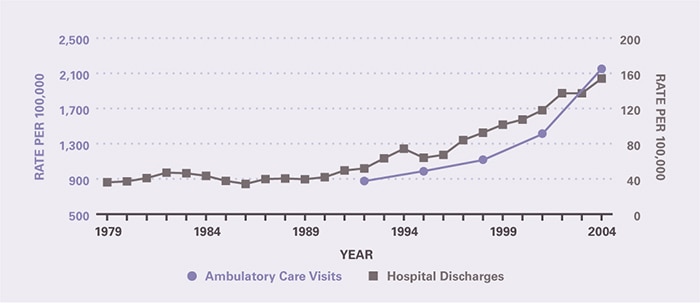
Table 2. Chronic Constipation: Number and Age-Adjusted Rates of Deaths and Years of Potential Life Lost (to Age 75) by Age, Race, and Sex in the United States, 2004
| Demographic Characteristics | Underlying Cause Number of Deaths | Underlying Cause Rate per 100,000 | Underlying Cause Years of Potential Life Lost in Thousands | Underlying or Other Cause Number of Deaths | Underlying or Other Cause Rate per 100,000 |
|---|---|---|---|---|---|
| AGE (Years) Under 15 |
3 | 0.0 | 0.2 | 6 | 0.0 |
| AGE (Years) 15–44 |
11 | 0.0 | 0.5 | 22 | 0.0 |
| AGE (Years) 45–64 |
10 | 0.0 | 0.2 | 54 | 0.1 |
| AGE (Years) 65+ |
113 | 0.3 | 0.1 | 500 | 1.4 |
| Race White |
129 | 0.1 | 0.8 | 527 | 0.2 |
| Race Black |
7 | 0.0 | 0.1 | 48 | 0.1 |
| Sex Female |
98 | 0.1 | 0.4 | 381 | 0.3 |
| Sex Male |
39 | 0.0 | 0.5 | 201 | 0.1 |
| Total | 137 | 0.0 | 0.9 | 582 | 0.2 |
Figure 2. Chronic Constipation: Age-Adjusted Rates of Death in the United States, 1979–2004
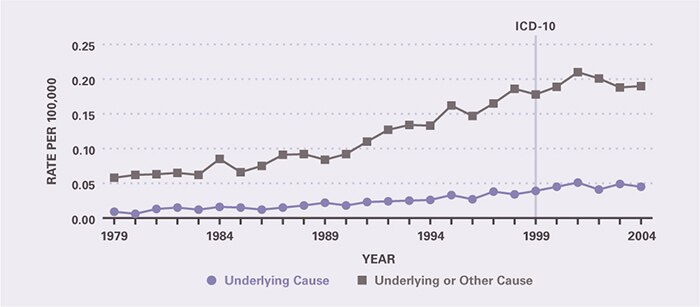
Table 3. Chronic Constipation: Costliest Prescriptions
| DRUG | Prescription (#) | Prescription | Retail Cost | Cost |
|---|---|---|---|---|
| Polyethylene Glycol 3350 | 2,462,873 | 46.0% | $78,006,220 | 43.8% |
| Tegaserod | 487,989 | 9.1 | 62,696,997 | 35.2 |
| Lactulose | 1,234,865 | 23.1 | 29,190,969 | 16.4 |
| Docusate® | 1,087,397 | 20.3 | 7,481,476 | 4.2 |
| Methylcellulose | 13,221 | 0.2 | 219,099 | 0.1 |
| Magnesium Hydroxide | 40,991 | 0.8 | 176,097 | 0.1 |
| Psyllium | 10,634 | 0.2 | 172,225 | 0.1 |
| Senna® | 4,085 | 0.1 | 139,618 | 0.1 |
| Bisacodyl | 10,271 | 0.2 | 57,569 | 0.0 |
| Malt Extract | 535 | 0.0 | 37,774 | 0.0 |
| Other | 3,432 | 0.0 | 66,635 | 0.0 |
| TOTAL | 5,356,293 | 100.0% | $178,244,679 | 100.0% |
Table 4. Irritable Bowel Syndrome: Number and Age-Adjusted Rates of Ambulatory Care Visits and Hospital Discharges With First-Listed and All-Listed Diagnoses by Age, Race, and Sex in the United States, 2004
| Demographic Characteristics | Ambulatory Care Visits First-Listed Diagnosis Number in Thousands | Ambulatory Care Visits First-Listed Diagnosis Rate per 100,000 | Ambulatory Care Visits All-Listed Diagnosis Number in Thousands | Ambulatory Care Visits All-Listed Diagnosis Rate per 100,000 | Hospital Discharges First-Listed Diagnosis Number in Thousands | Hospital Discharges First-Listed Diagnosis Rate per 100,000 | Hospital Discharges All-Listed Diagnosis Number in Thousands | Hospital Discharges All-Listed Diagnosis Rate per 100,000 |
|---|---|---|---|---|---|---|---|---|
| AGE (Years) Under 15 |
— | — | — | — | 0 | 1 | 1 | 2 |
| AGE (Years) 15–44 |
724 | 575 | 1,169 | 929 | 8 | 6 | 61 | 48 |
| AGE (Years) 45–64 |
363 | 514 | 979 | 1,384 | 5 | 7 | 73 | 103 |
| AGE (Years) 65+ |
469 | 1,290 | 792 | 2,179 | 4 | 11 | 77 | 213 |
| Race White |
1,459 | 593 | 2,803 | 1,138 | 15 | 6 | 180 | 72 |
| Race Black |
— | — | 212 | 534 | 1 | 4 | 12 | 36 |
| Sex Female |
1,322 | 867 | 2,531 | 1,649 | 14 | 9 | 177 | 112 |
| Sex Male |
283 | 201 | 523 | 373 | 4 | 2 | 35 | 26 |
| Total | 1,605 | 547 | 3,054 | 1,040 | 18 | 6 | 212 | 72 |
Figure 3. Irritable Bowel Syndrome: Age-Adjusted Rates of Ambulatory Care Visits and Hospital Discharges With All–Listed Diagnoses in the United States, 1979–2004
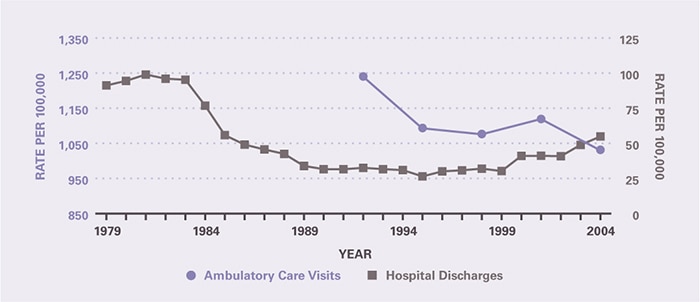
Table 5. Irritable Bowel Syndrome: Number and Age-Adjusted Rates of Deaths and Years of Potential Life Lost (to Age 75) by Age, Race, and Sex in the United States, 2004
| Demographic Characteristics | Underlying Cause Number of Deaths | Underlying Cause Rate per 100,000 | Underlying Cause Years of Potential Life Lost in Thousands | Underlying or Other Cause Number of Deaths | Underlying or Other Cause Rate per 100,000 |
|---|---|---|---|---|---|
| AGE (Years) Under 15 |
— | — | — | — | — |
| AGE (Years) 15–44 |
— | — | — | 7 | 0.0 |
| AGE (Years) 45–64 |
1 | 0.0 | 0.0 | 21 | 0.0 |
| AGE (Years) 65+ |
19 | 0.1 | 0.0 | 188 | 0.5 |
| Race White |
19 | 0.0 | 0.0 | 210 | 0.1 |
| Race Black |
1 | 0.0 | 0.0 | 5 | 0.0 |
| Sex Female |
16 | 0.0 | 0.0 | 164 | 0.1 |
| Sex Male |
4 | 0.0 | 0.0 | 52 | 0.0 |
| Total | 20 | 0.0 | 0.0 | 216 | 0.1 |
Figure 4. Irritable Bowel Syndrome: Age-Adjusted Rates of Death in the United States, 1979–2004
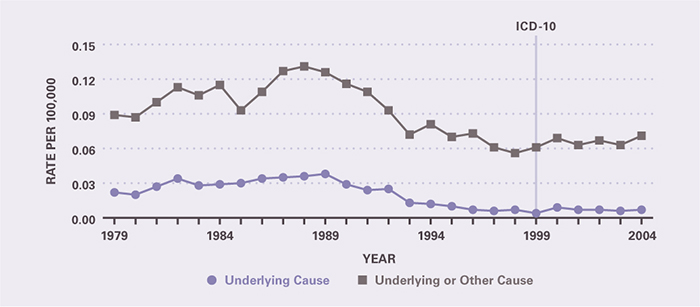
Table 6. Irritable Bowel Syndrome: Costliest Prescriptions
| DRUG | Prescription (#) | Prescription | Retail Cost | Cost |
|---|---|---|---|---|
| Tegaserod | 1,101,880 | 18.6% | $171,155,138 | 58.1% |
| Hyoscyamine | 1,574,929 | 26.5 | 34,810,797 | 11.8 |
| Dicyclomine | 1,317,179 | 22.2 | 20,669,937 | 7.0 |
| Glycopyrrolate | 222,748 | 3.8 | 19,877,577 | 6.7 |
| Clidinium/Chlordiazepoxide | 731,965 | 12.3 | 11,525,984 | 3.9 |
| Diphenoxylate | 372,133 | 6.3 | 7,711,178 | 2.6 |
| Pantoprazole | 45,496 | 0.8 | 7,384,419 | 2.5 |
| Omeprazole | 76,680 | 1.3 | 5,384,300 | 1.8 |
| Esomeprazole | 38,526 | 0.6 | 4,546,806 | 1.5 |
| Methscopolamine | 70,911 | 1.2 | 4,393,505 | 1.5 |
| Other | 383,137 | 6.3 | 7,201,054 | 2.4 |
| TOTAL | 5,935,584 | 100.0% | $294,660,695 | 100.0% |
Table 7. All Functional Intestinal Disorders: Number and Age-Adjusted Rates of Ambulatory Care Visits and Hospital Discharges With First-Listed and All-Listed Diagnoses by Age, Race, and Sex in the United States, 2004
| Demographic Characteristics | Ambulatory Care Visits First-Listed Diagnosis Number in Thousands | Ambulatory Care Visits First-Listed Diagnosis Rate per 100,000 | Ambulatory Care Visits All-Listed Diagnosis Number in Thousands | Ambulatory Care Visits All-Listed Diagnosis Rate per 100,000 | Hospital Discharges First-Listed Diagnosis Number in Thousands | Hospital Discharges First-Listed Diagnosis Rate per 100,000 | Hospital Discharges All-Listed Diagnosis Number in Thousands | Hospital Discharges All-Listed Diagnosis Rate per 100,000 |
|---|---|---|---|---|---|---|---|---|
| AGE (Years) Under 15 |
1,347 | 2,215 | 2,384 | 3,921 | 10 | 17 | 48 | 79 |
| AGE (Years) 15–44 |
1,710 | 1,359 | 3,256 | 2,588 | 29 | 23 | 248 | 197 |
| AGE (Years) 45–64 |
1,127 | 1,594 | 2,700 | 3,820 | 30 | 42 | 341 | 483 |
| AGE (Years) 65+ |
1,762 | 4,851 | 3,308 | 9,104 | 45 | 124 | 603 | 1,660 |
| Race White |
5,039 | 2,057 | 9,690 | 3,980 | 86 | 35 | 944 | 373 |
| Race Black |
633 | 1,513 | 1,391 | 3,702 | 16 | 54 | 169 | 546 |
| Sex Female |
3,886 | 2,518 | 7,778 | 5,074 | 76 | 47 | 808 | 496 |
| Sex Male |
2,059 | 1,484 | 3,871 | 2,815 | 39 | 29 | 432 | 328 |
| Total | 5,945 | 2,025 | 11,648 | 3,967 | 115 | 39 | 1,241 | 423 |
Figure 5. All Functional Intestinal Disorders: Age-Adjusted Rates of Ambulatory Care Visits and Hospital Discharges With All–Listed Diagnoses in the United States, 1979–2004
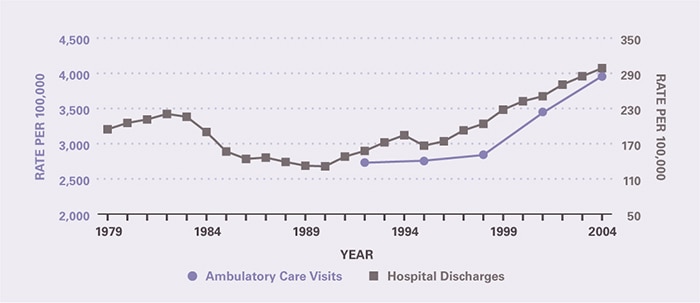
Table 8. All Functional Intestinal Disorders: Number and Age-Adjusted Rates of Deaths and Years of Potential Life Lost (to Age 75) by Age, Race, and Sex in the United States, 2004
| Demographic Characteristics | Underlying Cause Number of Deaths | Underlying Cause Rate per 100,000 | Underlying Cause Years of Potential Life Lost in Thousands | Underlying or Other Cause Number of Deaths | Underlying or Other Cause Rate per 100,000 |
|---|---|---|---|---|---|
| AGE (Years) Under 15 |
6 | 0.0 | 0.4 | 27 | 0.0 |
| AGE (Years) 15–44 |
21 | 0.0 | 0.9 | 106 | 0.1 |
| AGE (Years) 45–64 |
49 | 0.1 | 0.9 | 335 | 0.5 |
| AGE (Years) 65+ |
347 | 1.0 | 0.2 | 1,721 | 4.7 |
| Race White |
381 | 0.1 | 1.9 | 1,941 | 0.7 |
| Race Black |
36 | 0.1 | 0.5 | 214 | 0.8 |
| Sex Female |
266 | 0.1 | 0.9 | 1,297 | 0.7 |
| Sex Male |
157 | 0.1 | 1.6 | 892 | 0.7 |
| Total | 423 | 0.1 | 2.5 | 2,189 | 0.7 |
Figure 6. All Functional Intestinal Disorders: Age-Adjusted Rates of Death in the United States, 1979–2004
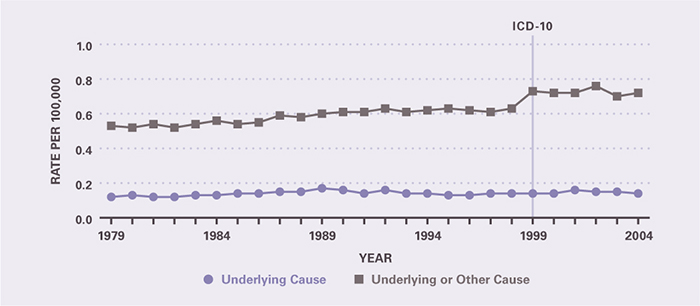
Table 9. All Functional Intestinal Disorders: Costliest Prescriptions
| DRUG | Prescription (#) | Prescription | Retail Cost | Cost |
|---|---|---|---|---|
| Tegaserod | 1,618,699 | 11.6% | $238,030,688 | 32.0% |
| Lansoprazole | 695,616 | 5.0 | 85,935,464 | 11.6 |
| Polyethylene glycol 3350 | 2,647,099 | 19.0 | 84,291,600 | 11.3 |
| Esomeprazole | 395,269 | 2.8 | 64,101,386 | 8.6 |
| Pantoprazole | 592,957 | 4.3 | 60,350,131 | 8.1 |
| Hyoscyamine | 1,787,325 | 12.8 | 40,443,459 | 5.4 |
| Lactulose | 1,278,184 | 9.2 | 30,168,691 | 4.1 |
| Rabeprazole | 303,450 | 2.2 | 29,843,464 | 4.0 |
| Omeprazole | 303,450 | 1.7 | 23,755,697 | 3.2 |
| Glycopyrrolate | 242,494 | 1.7 | 20,706,229 | 2.8 |
| Other | 4,114,833 | 29.6 | 65,854,357 | 8.9 |
| Total | 13,914,807 | 100.0% | $743,481,166 | 100.0% |